
Market analytics · Categories
Where the money is on Uzum — at a glance
13,000+ Uzum categories on one map: volume, growth and competition. Check a niche with numbers before buying.
No store connection neededNo card requiredFrom 499,000 so'm a month
What's on the screen
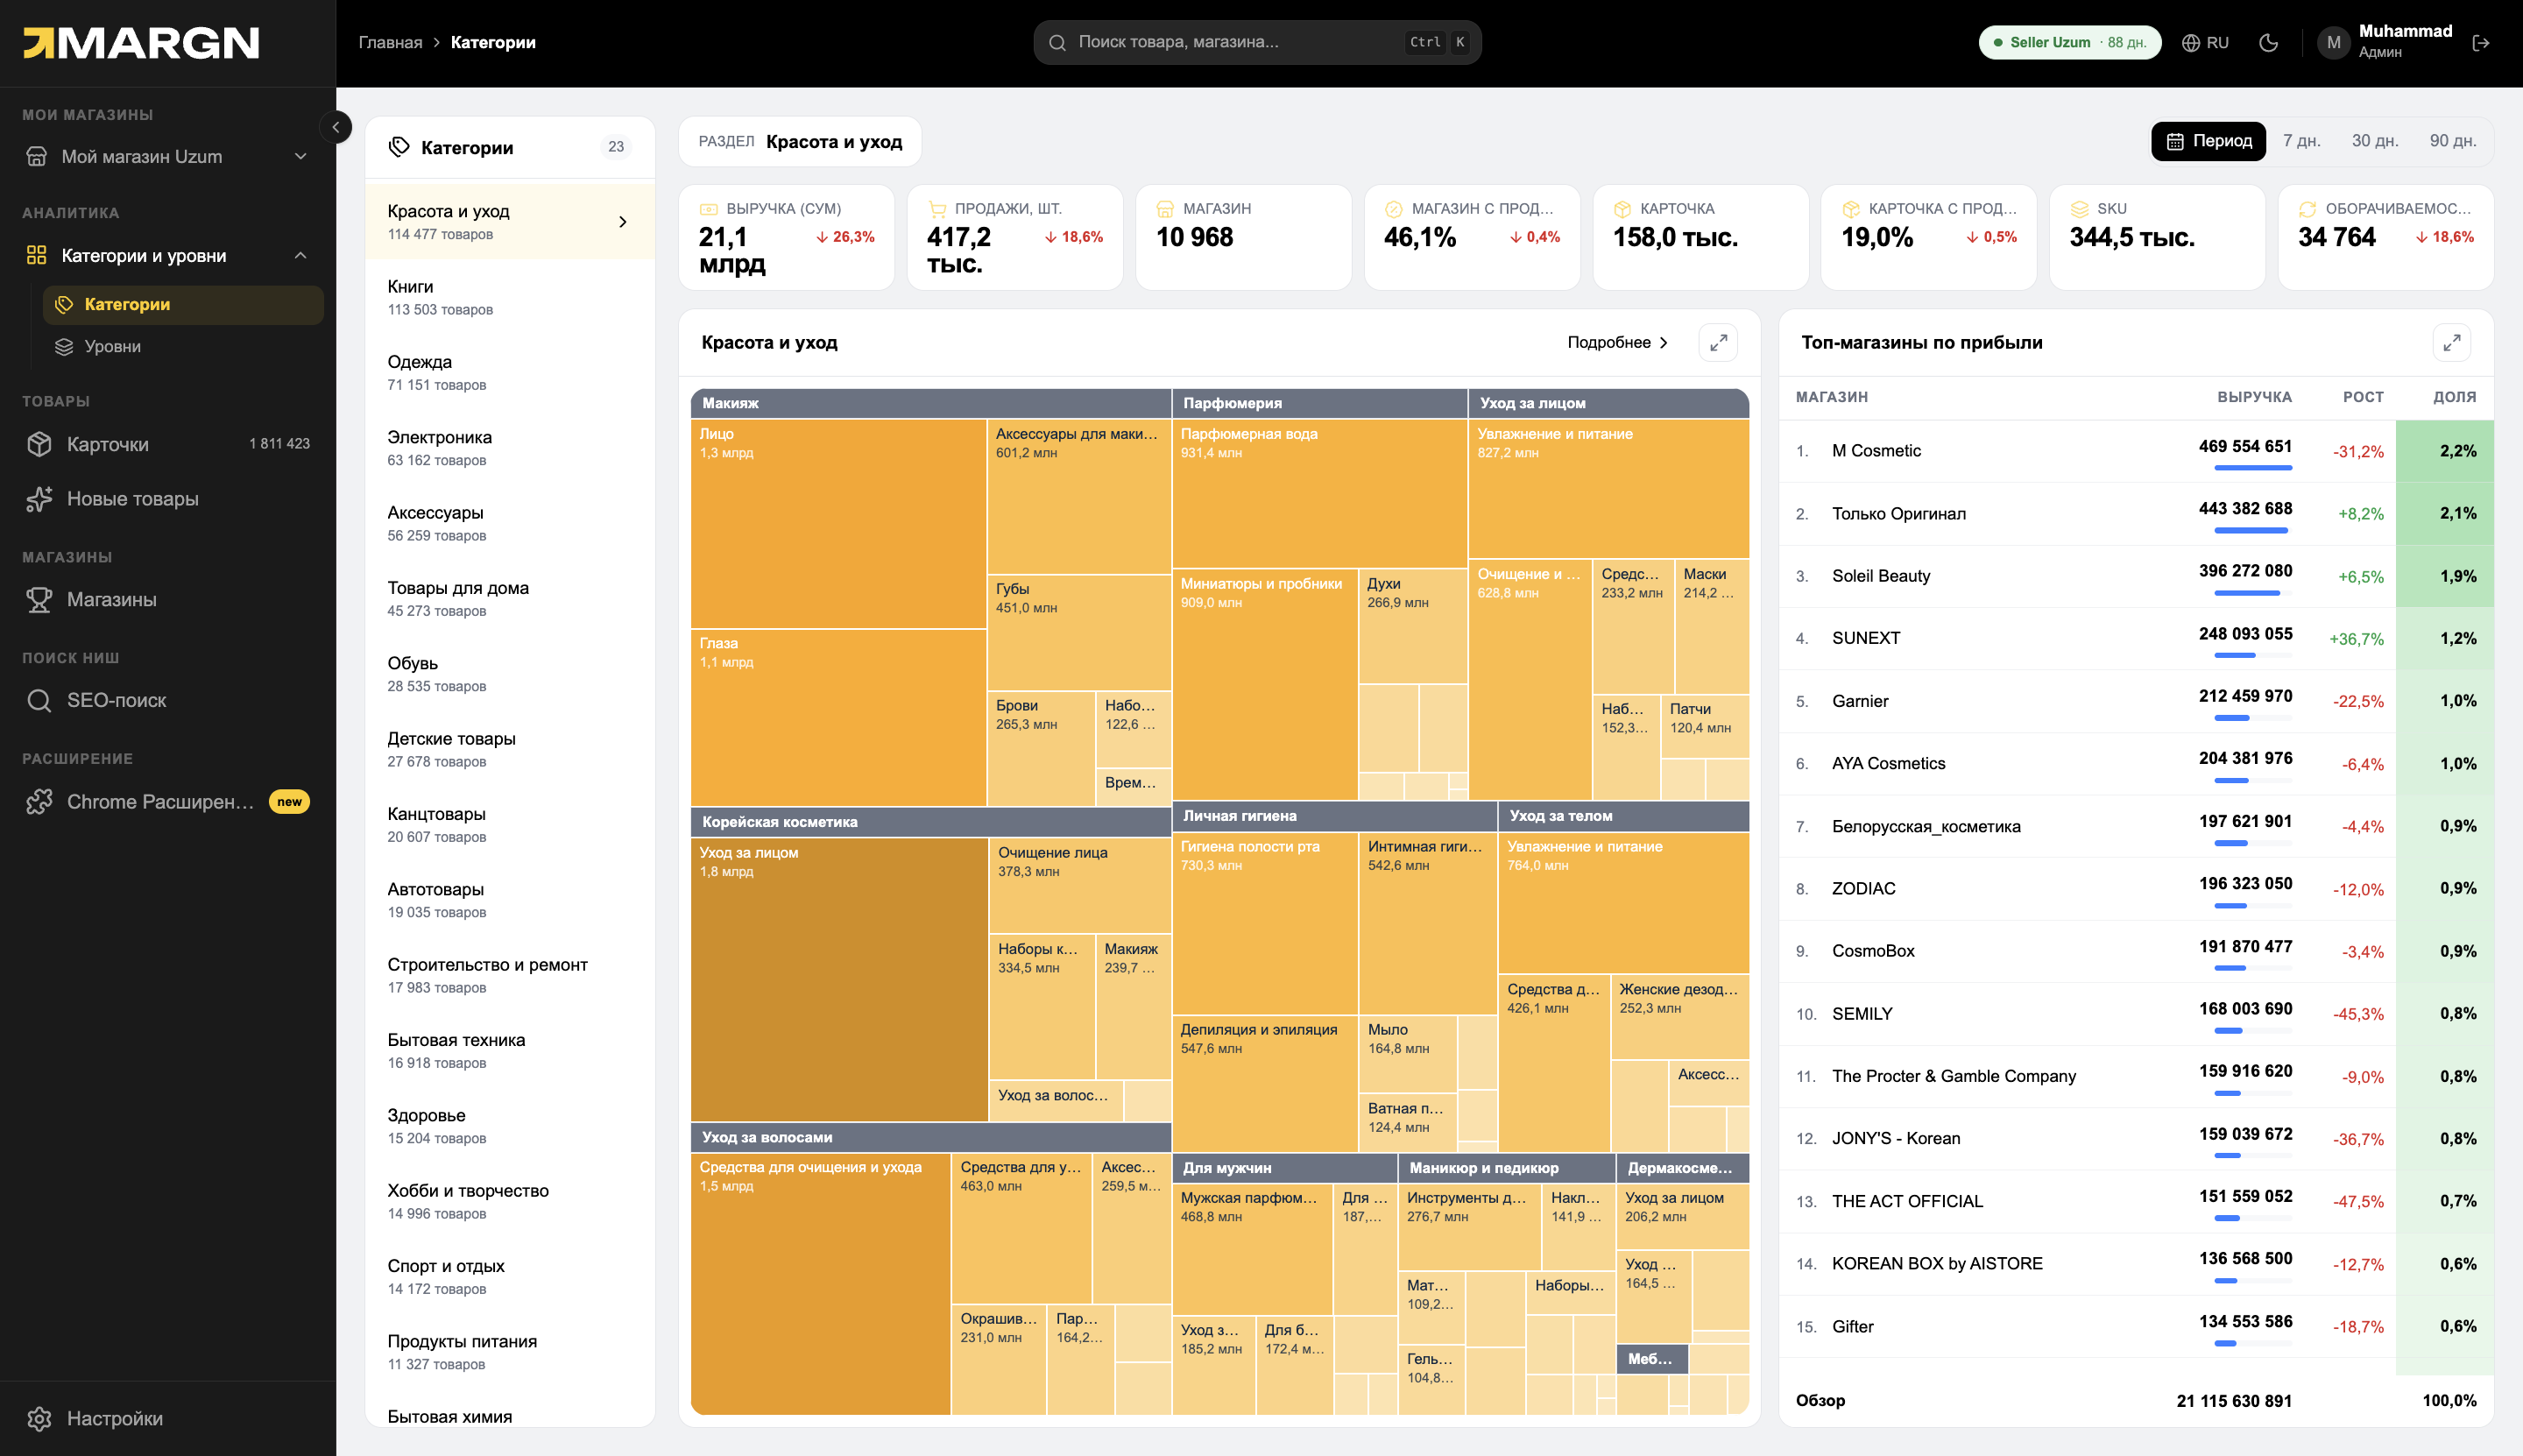
1
List of 23 sectionsSections with the number of products — drill deeper in one click.
2
Key metricsRevenue, sales, stores, share of cards with sales and growth %.
3
Category mapThe bigger the block, the more money. The color shows growth.
4
Top storesWho earns how much in the category and their market share.
13 000+categories and 23 sections
3× a daydata refresh
7 / 30 / 90days — periods
Questions it answers
How big is the niche?Category revenue for the month and number of sales.
Is it growing or falling?Growth in percent versus the previous period.
How strong is the competition?How many stores there are and how many of them actually sell.
Who controls the market?Top stores and their share.
How it works
1Choose a sectionFor example, "Beauty and care".
2Read the mapLarge green blocks — there is money and it is growing.
3Drill deeperDown to the level of cards and stores.
Questions and answers
How is category revenue calculated?
From the sales and price of each card in the open Uzum catalog. The whole catalog is recalculated 3 times a day.
Do I need to connect a store?
No. Market analytics works on open data — registration is enough.
Which periods are available?
7, 30 and 90 days or your own date range. Starter has 90 days of history, Pro has the full history.
See the market in numbers
7 days of full access. No card needed.