
Uzum Market analytics — market analysis in numbers
Which product sells, which niche is growing and how much a competitor earns — not by eye, but in numbers. MARGN shows the whole Uzum market and your store on one platform.
What Uzum analytics is
Uzum analytics is the collection of data on sales, prices, stock and competition on the marketplace, presented in a form you can make decisions from. Thousands of stores compete in a single search query: it is impossible to understand which product sells, which niche is growing and how much a competitor earns by opening cards one by one.
Analytics looks in two directions. Market analytics looks outward: what and how much sells across all of Uzum. Store analytics looks inward: your sales, expenses and net profit. The first suggests what to sell, the second how to sell at a profit. In MARGN both are in one subscription.
What you can analyze
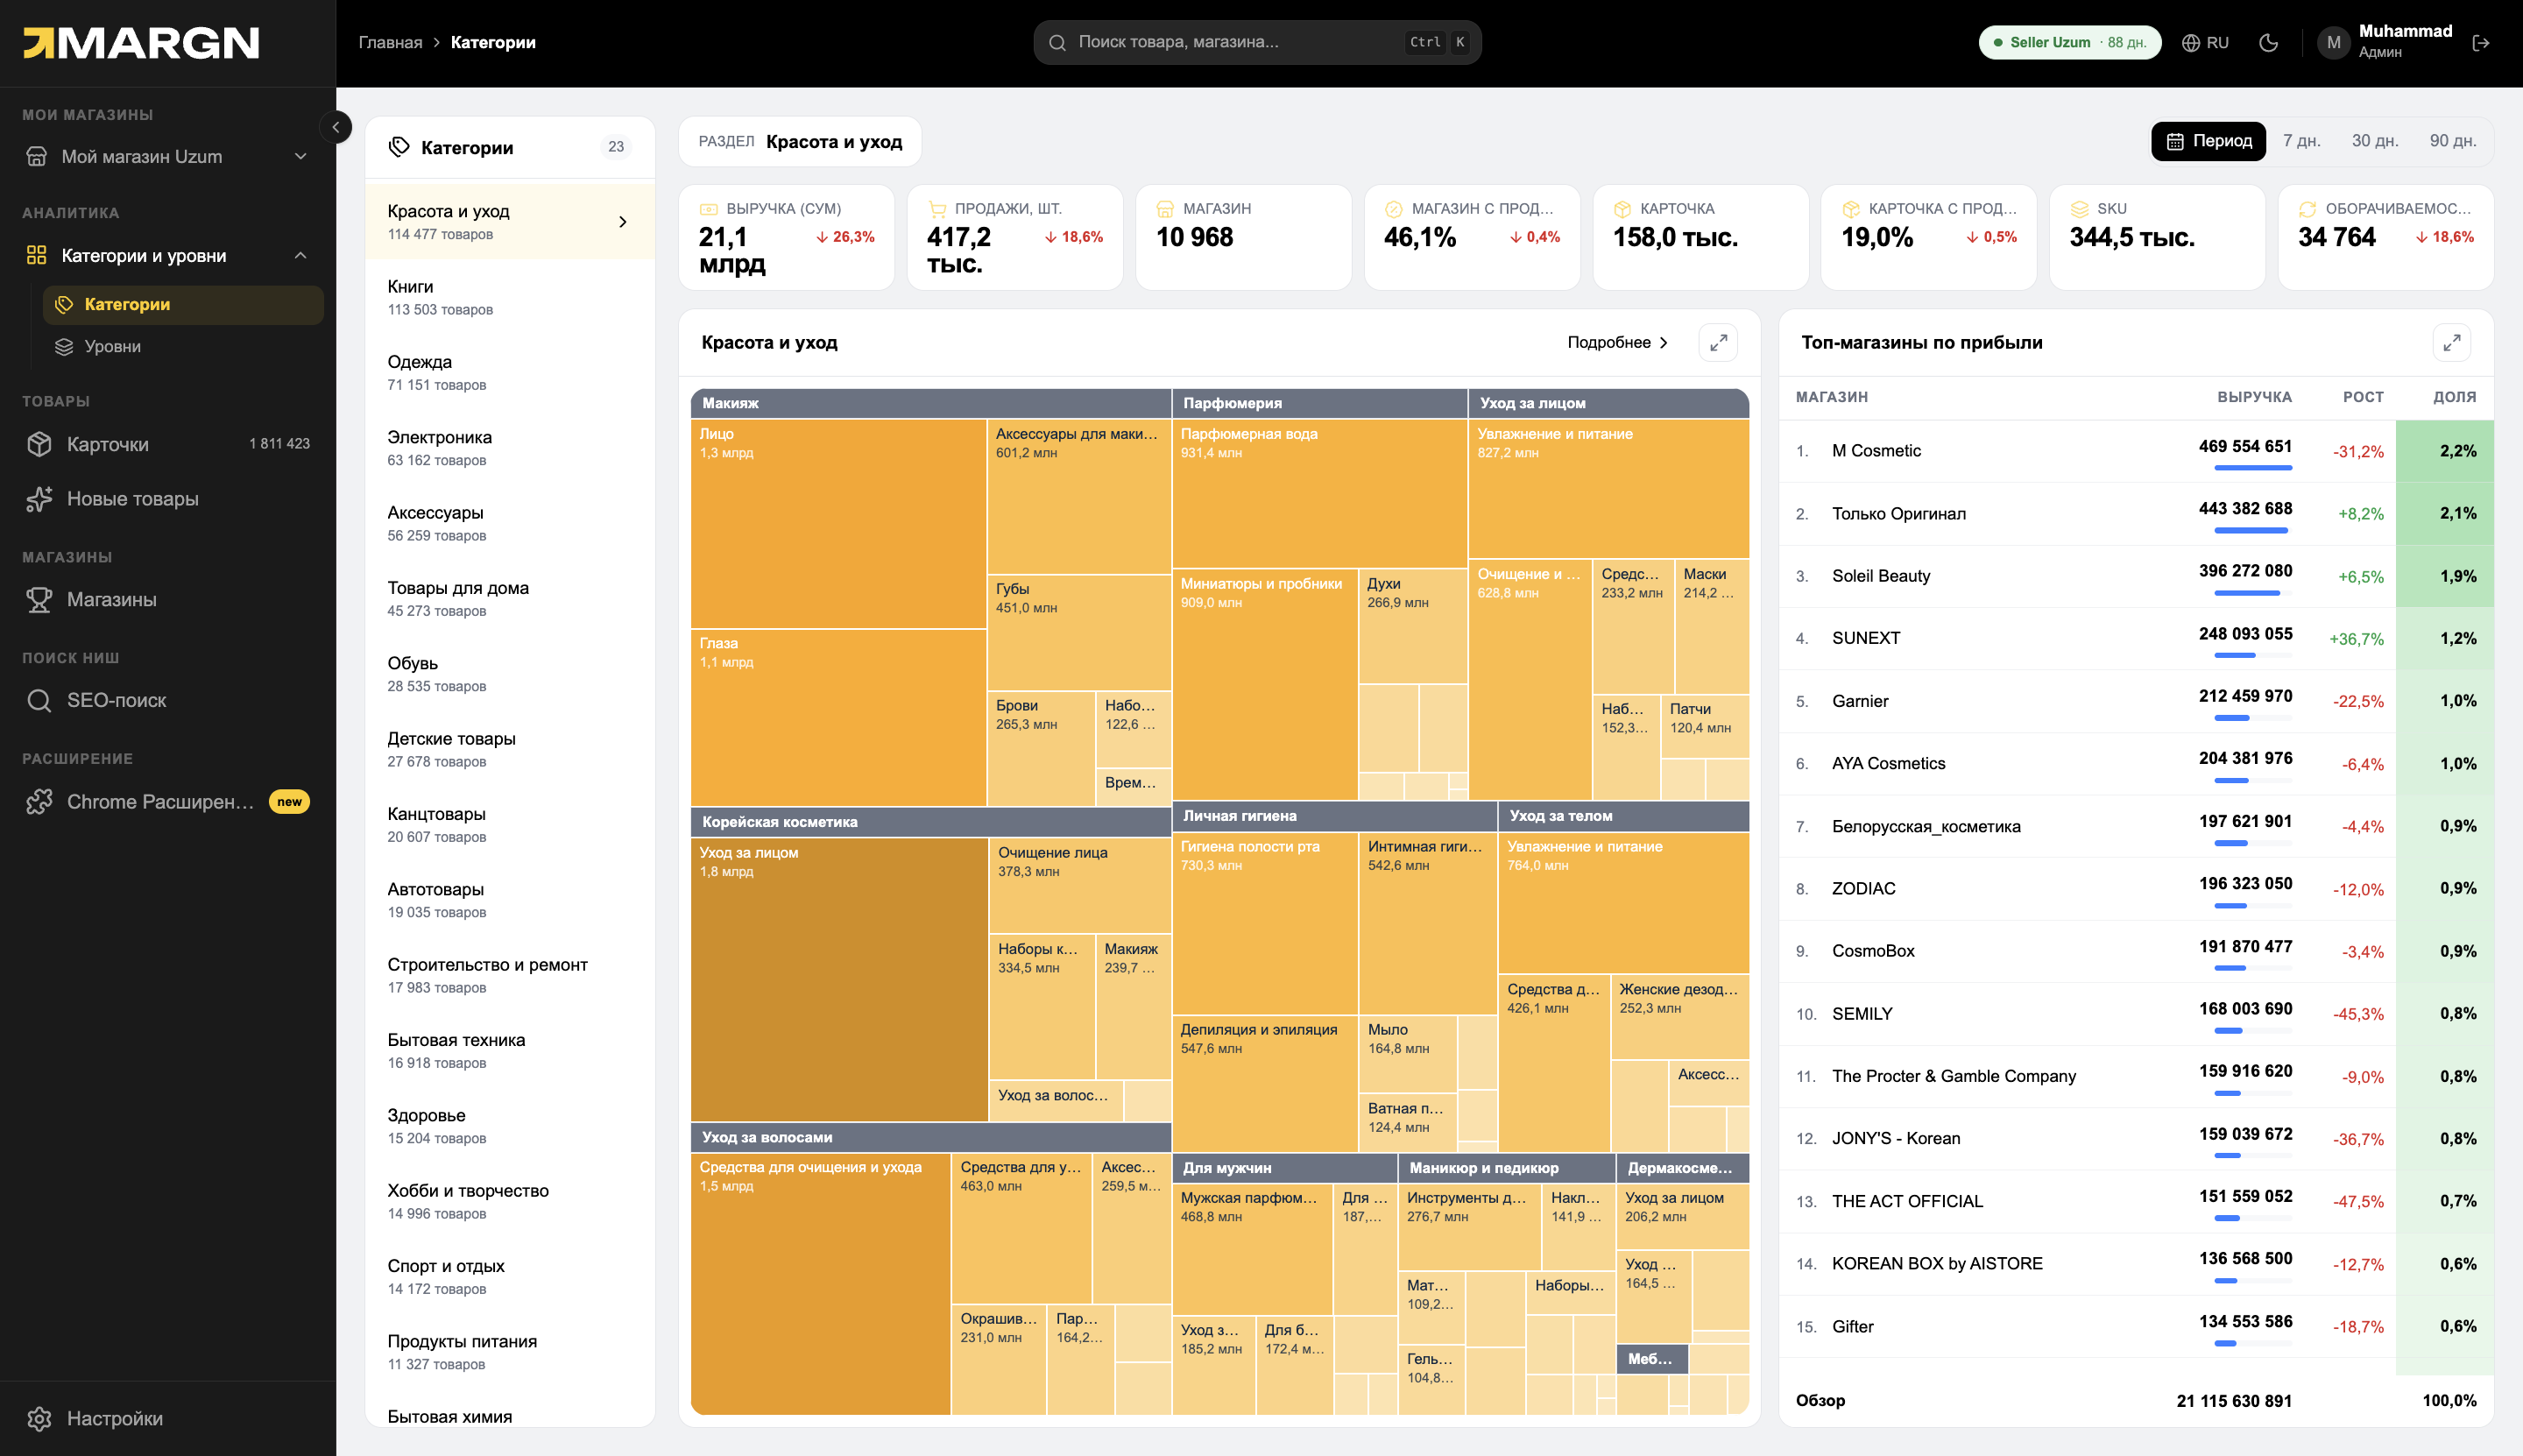
Category analysis: where the money is
The whole catalog on a map of 23 sections and 13,000+ categories. The larger the block, the more money in the category; the color shows growth versus the previous period.
- Category revenue for the month and number of sales
- Growth or decline in percent
- How many stores there are and how many of them actually sell
- Top stores and their share
Product analysis: what sells and how much
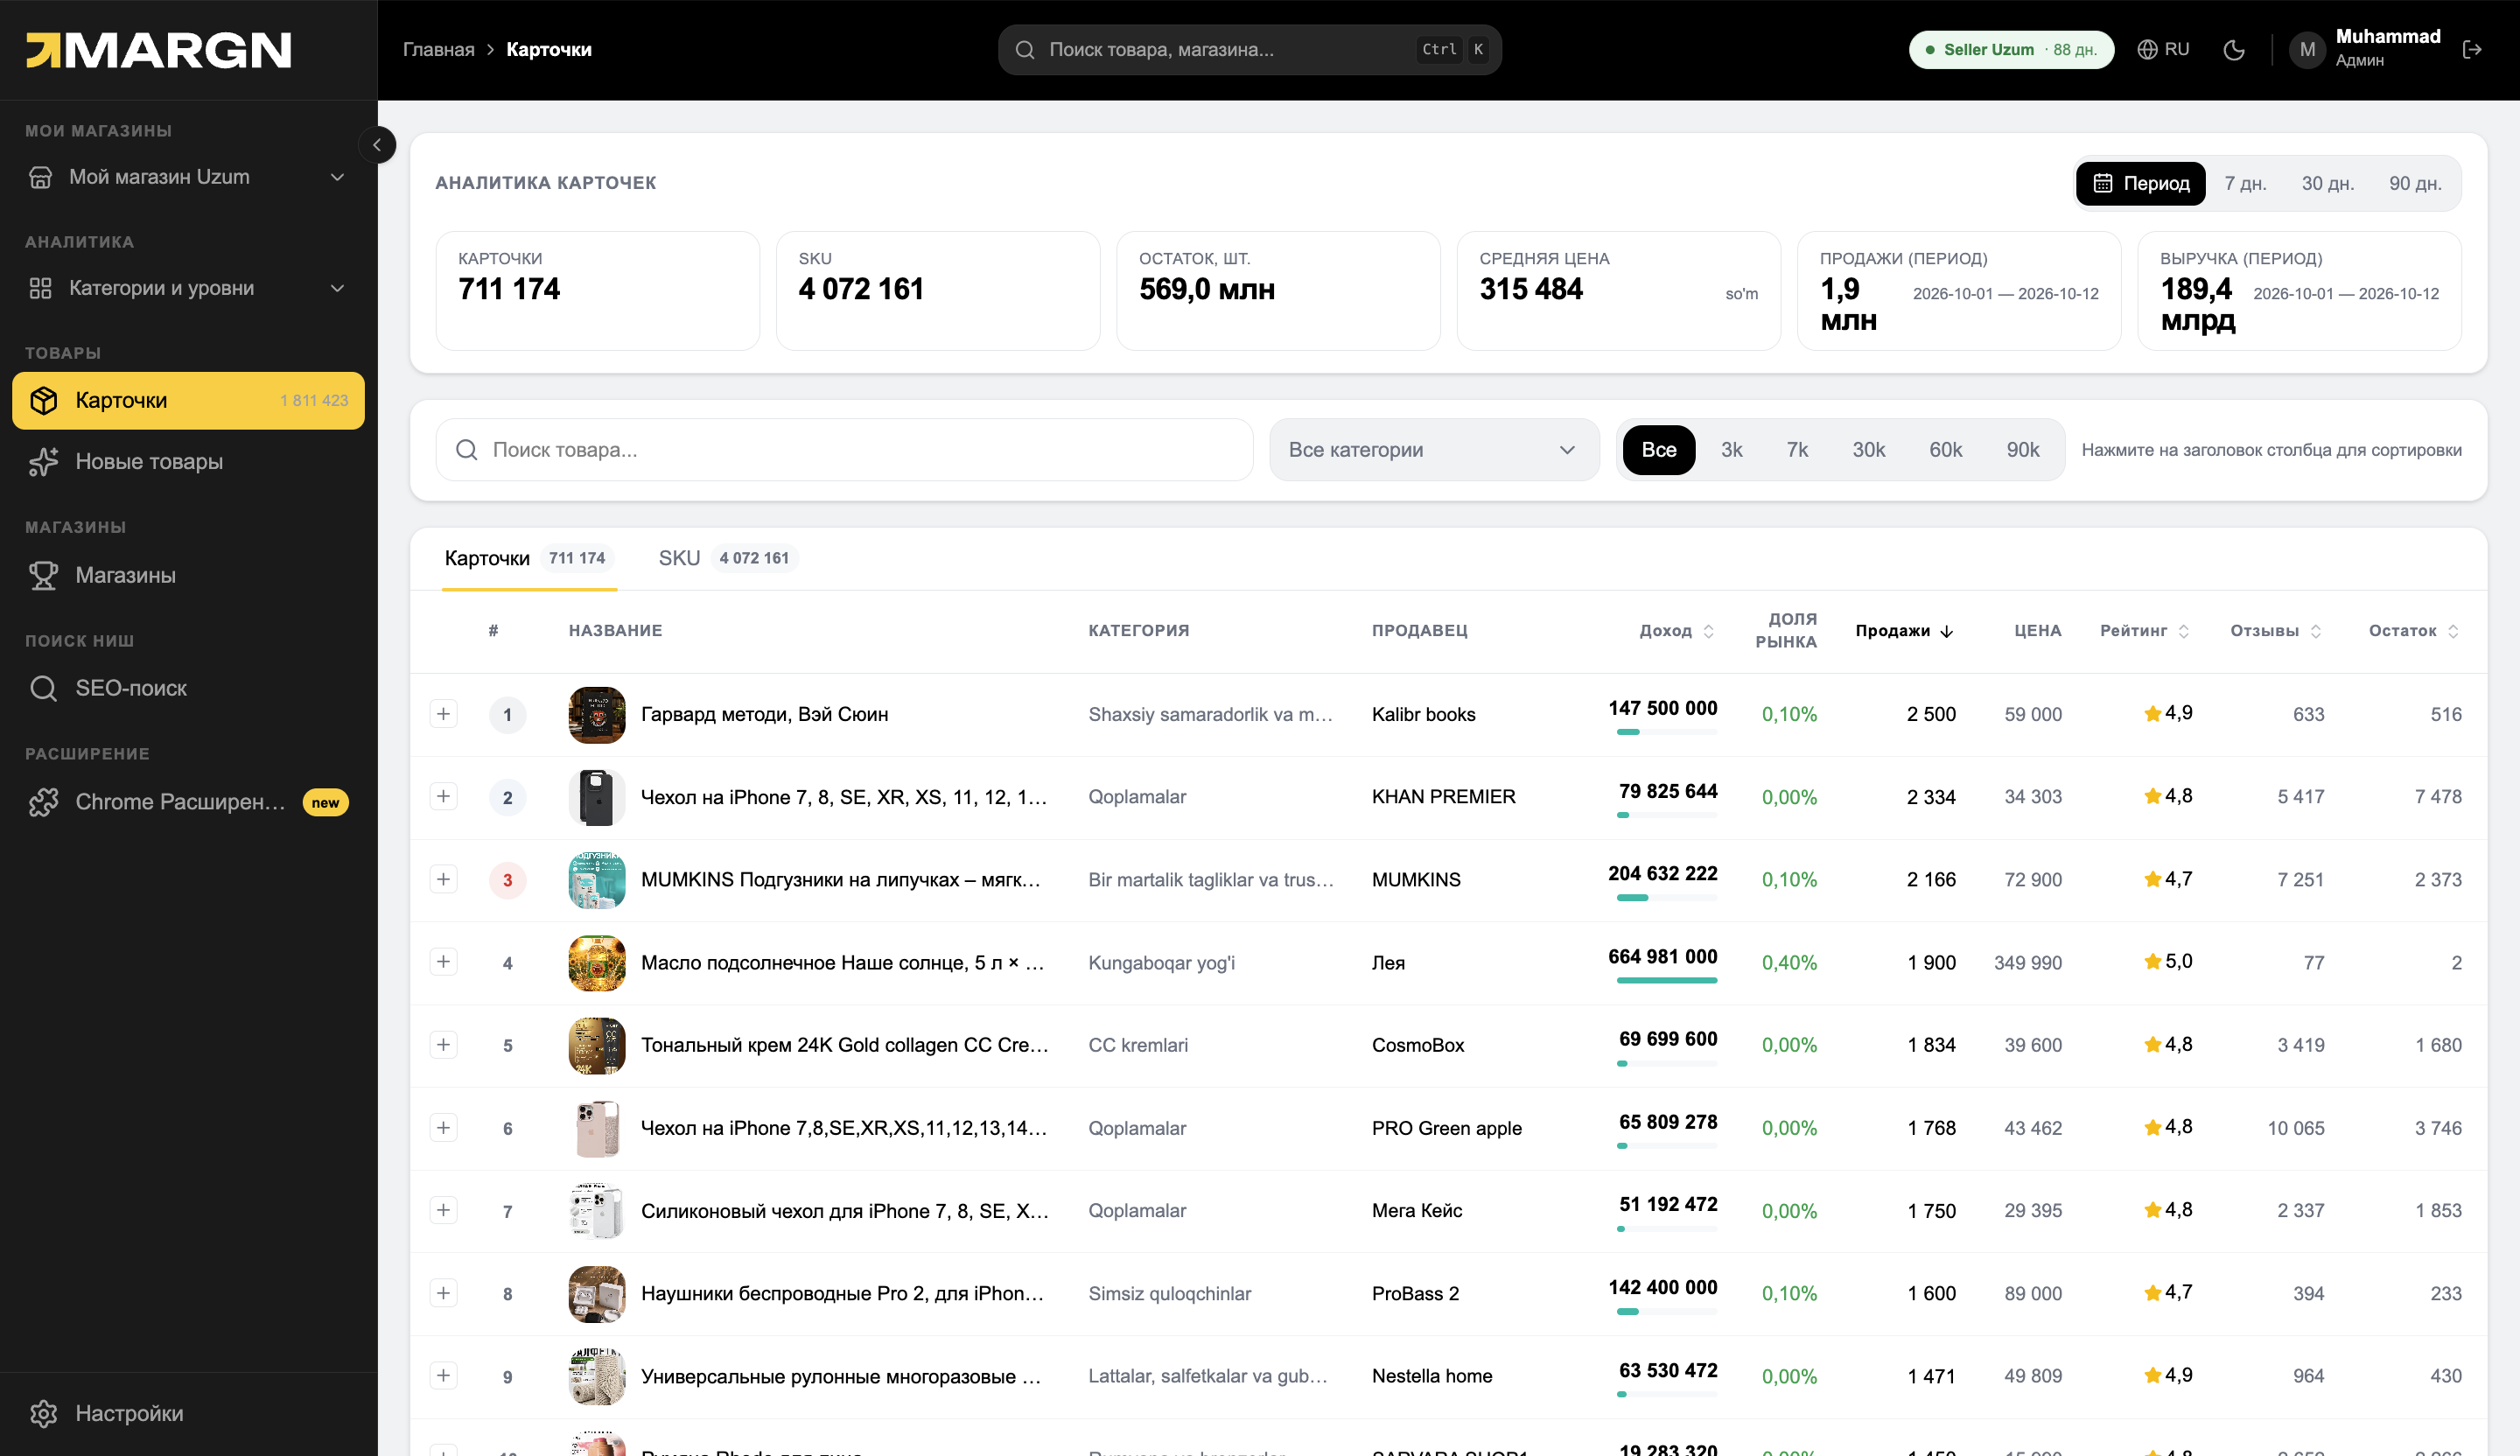
Cards are sorted by revenue — the strongest products on top. Open any one to see price, stock and sales for each SKU for each day: you can see when a discount worked and when a competitor ran out of stock.
- Revenue, sales and market share
- Price and stock history by day
- SKU sales by color, size and model
- Side-by-side card comparison
Competitor analysis: who earns how much
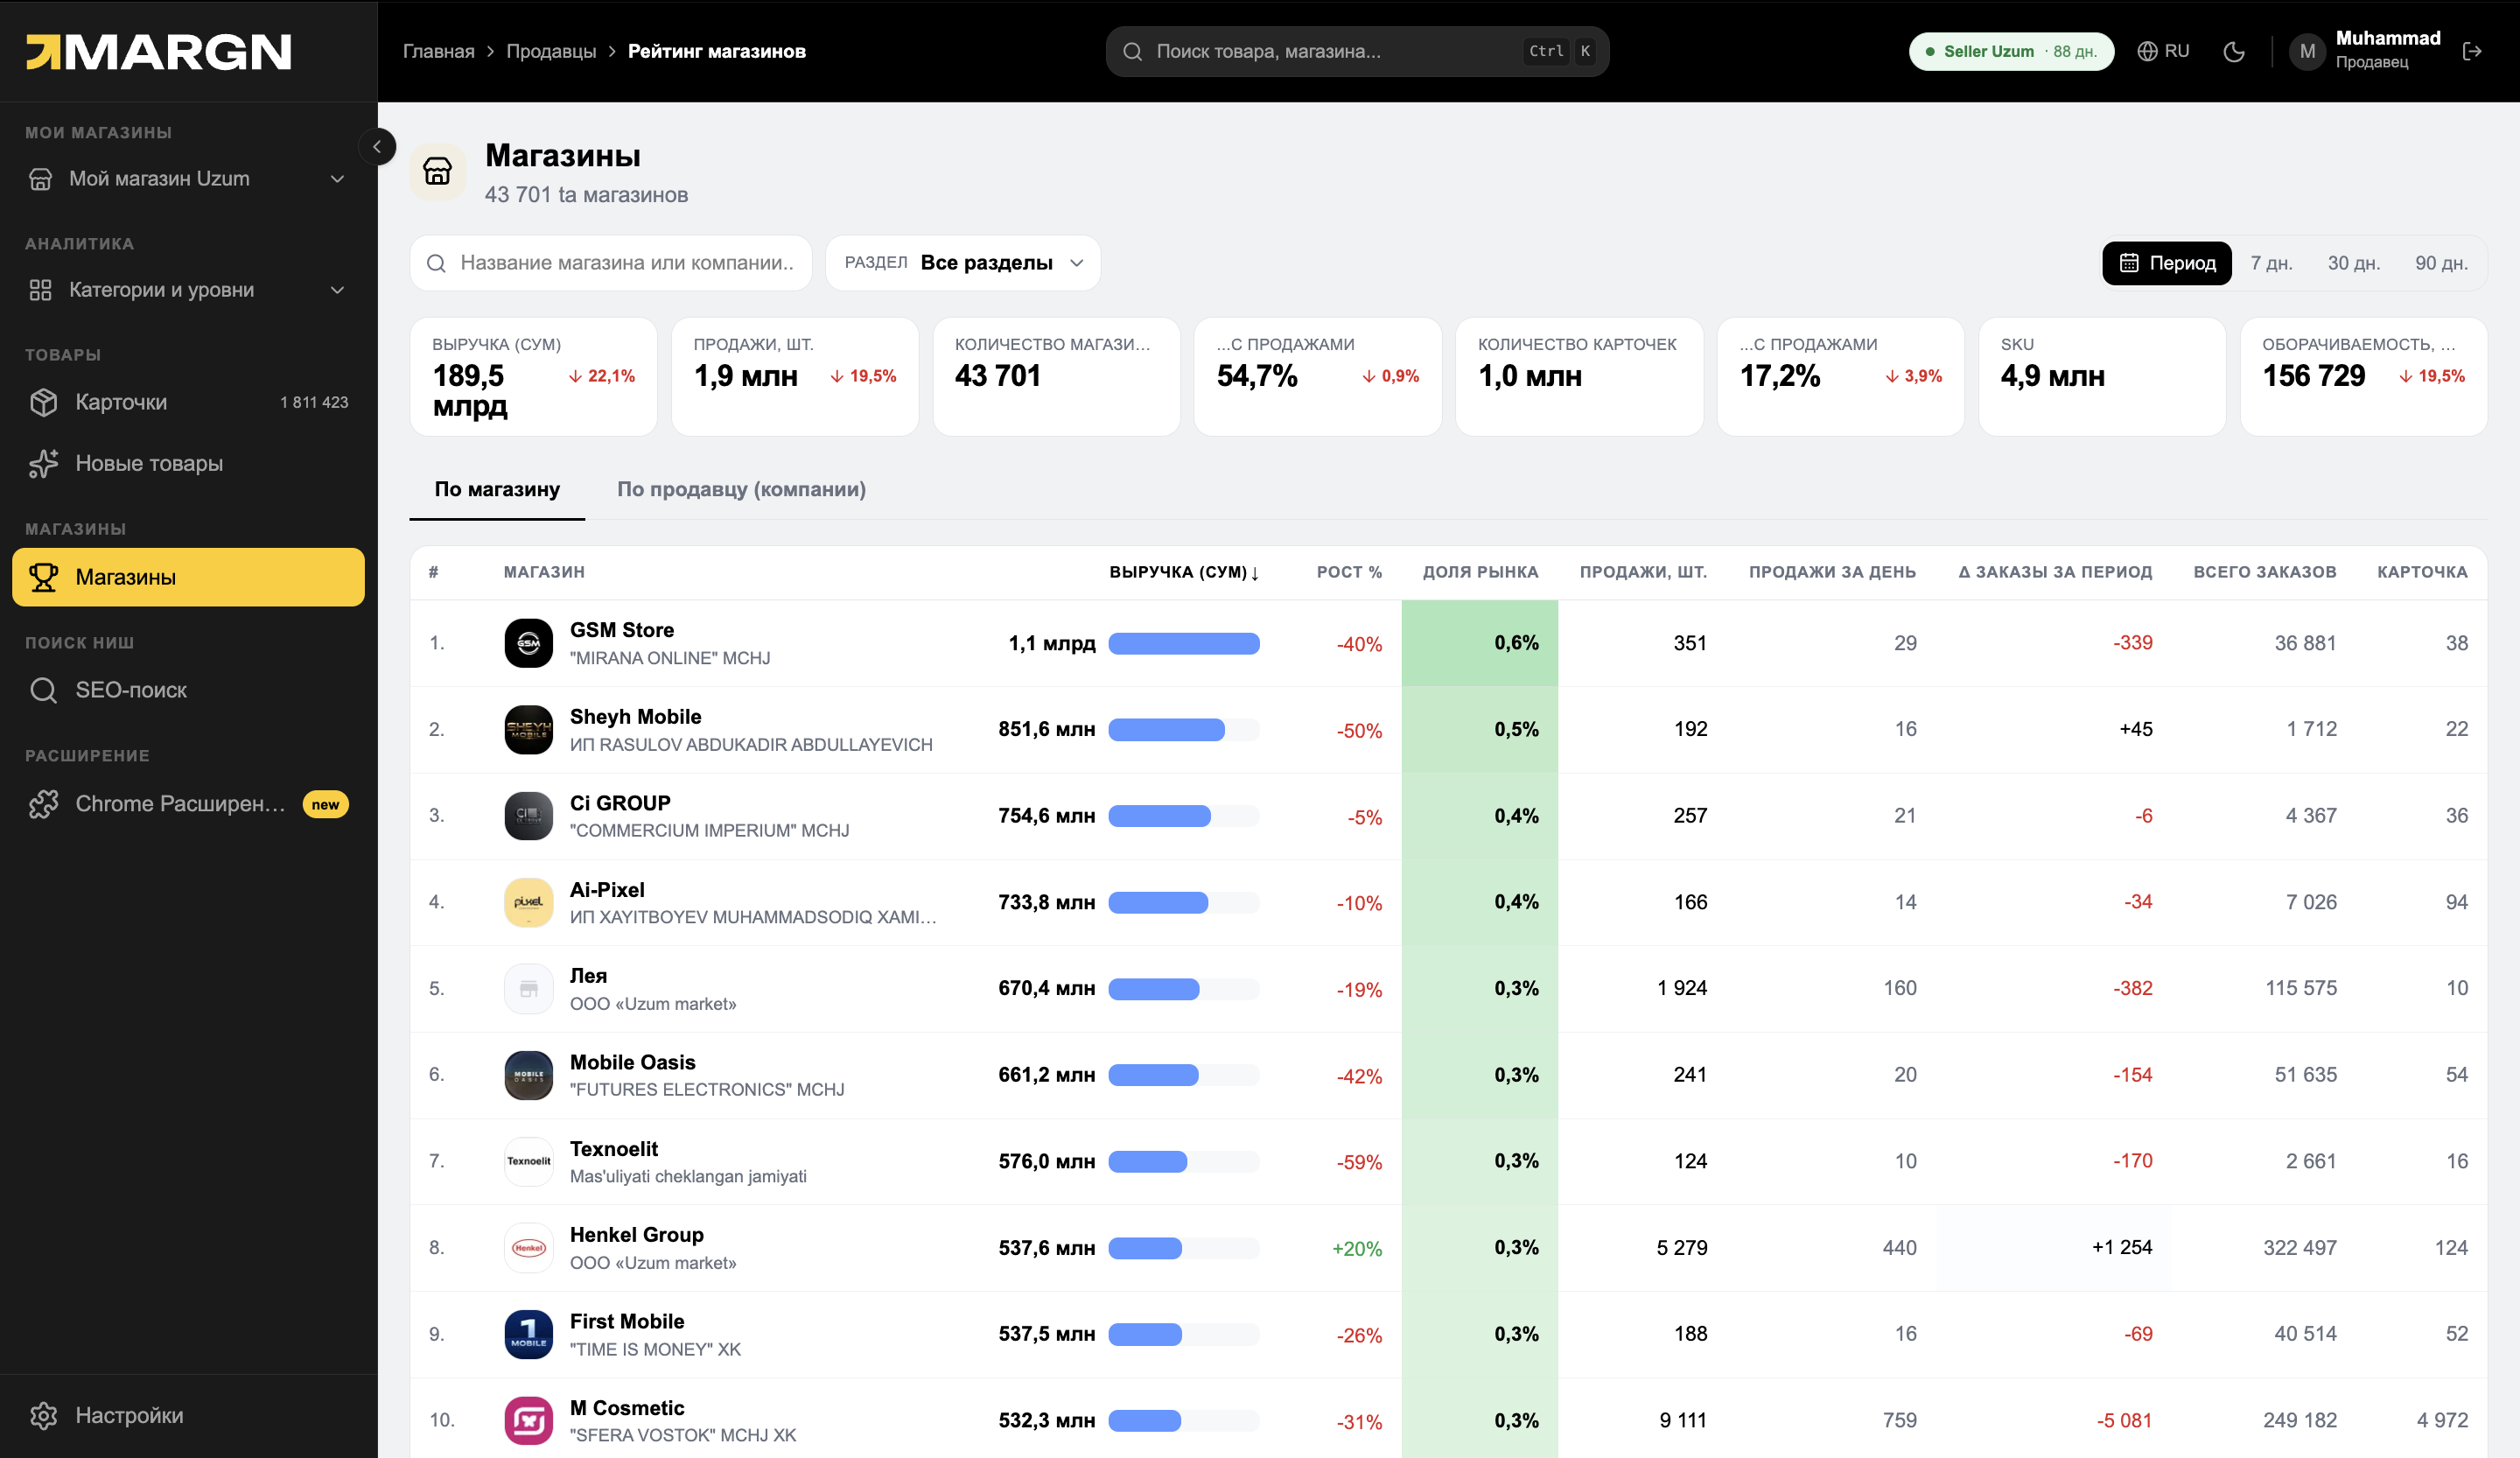
Active Uzum stores in one ranking: revenue, growth, market share and sales per day. Several stores of one company are combined into one row — you can see who really runs the market.
- Category leaders and fast-growing stores
- A competitor's assortment and daily sales
- Inside a store: categories, cards and keywords
Niches and search queries: there is demand, but is there room?
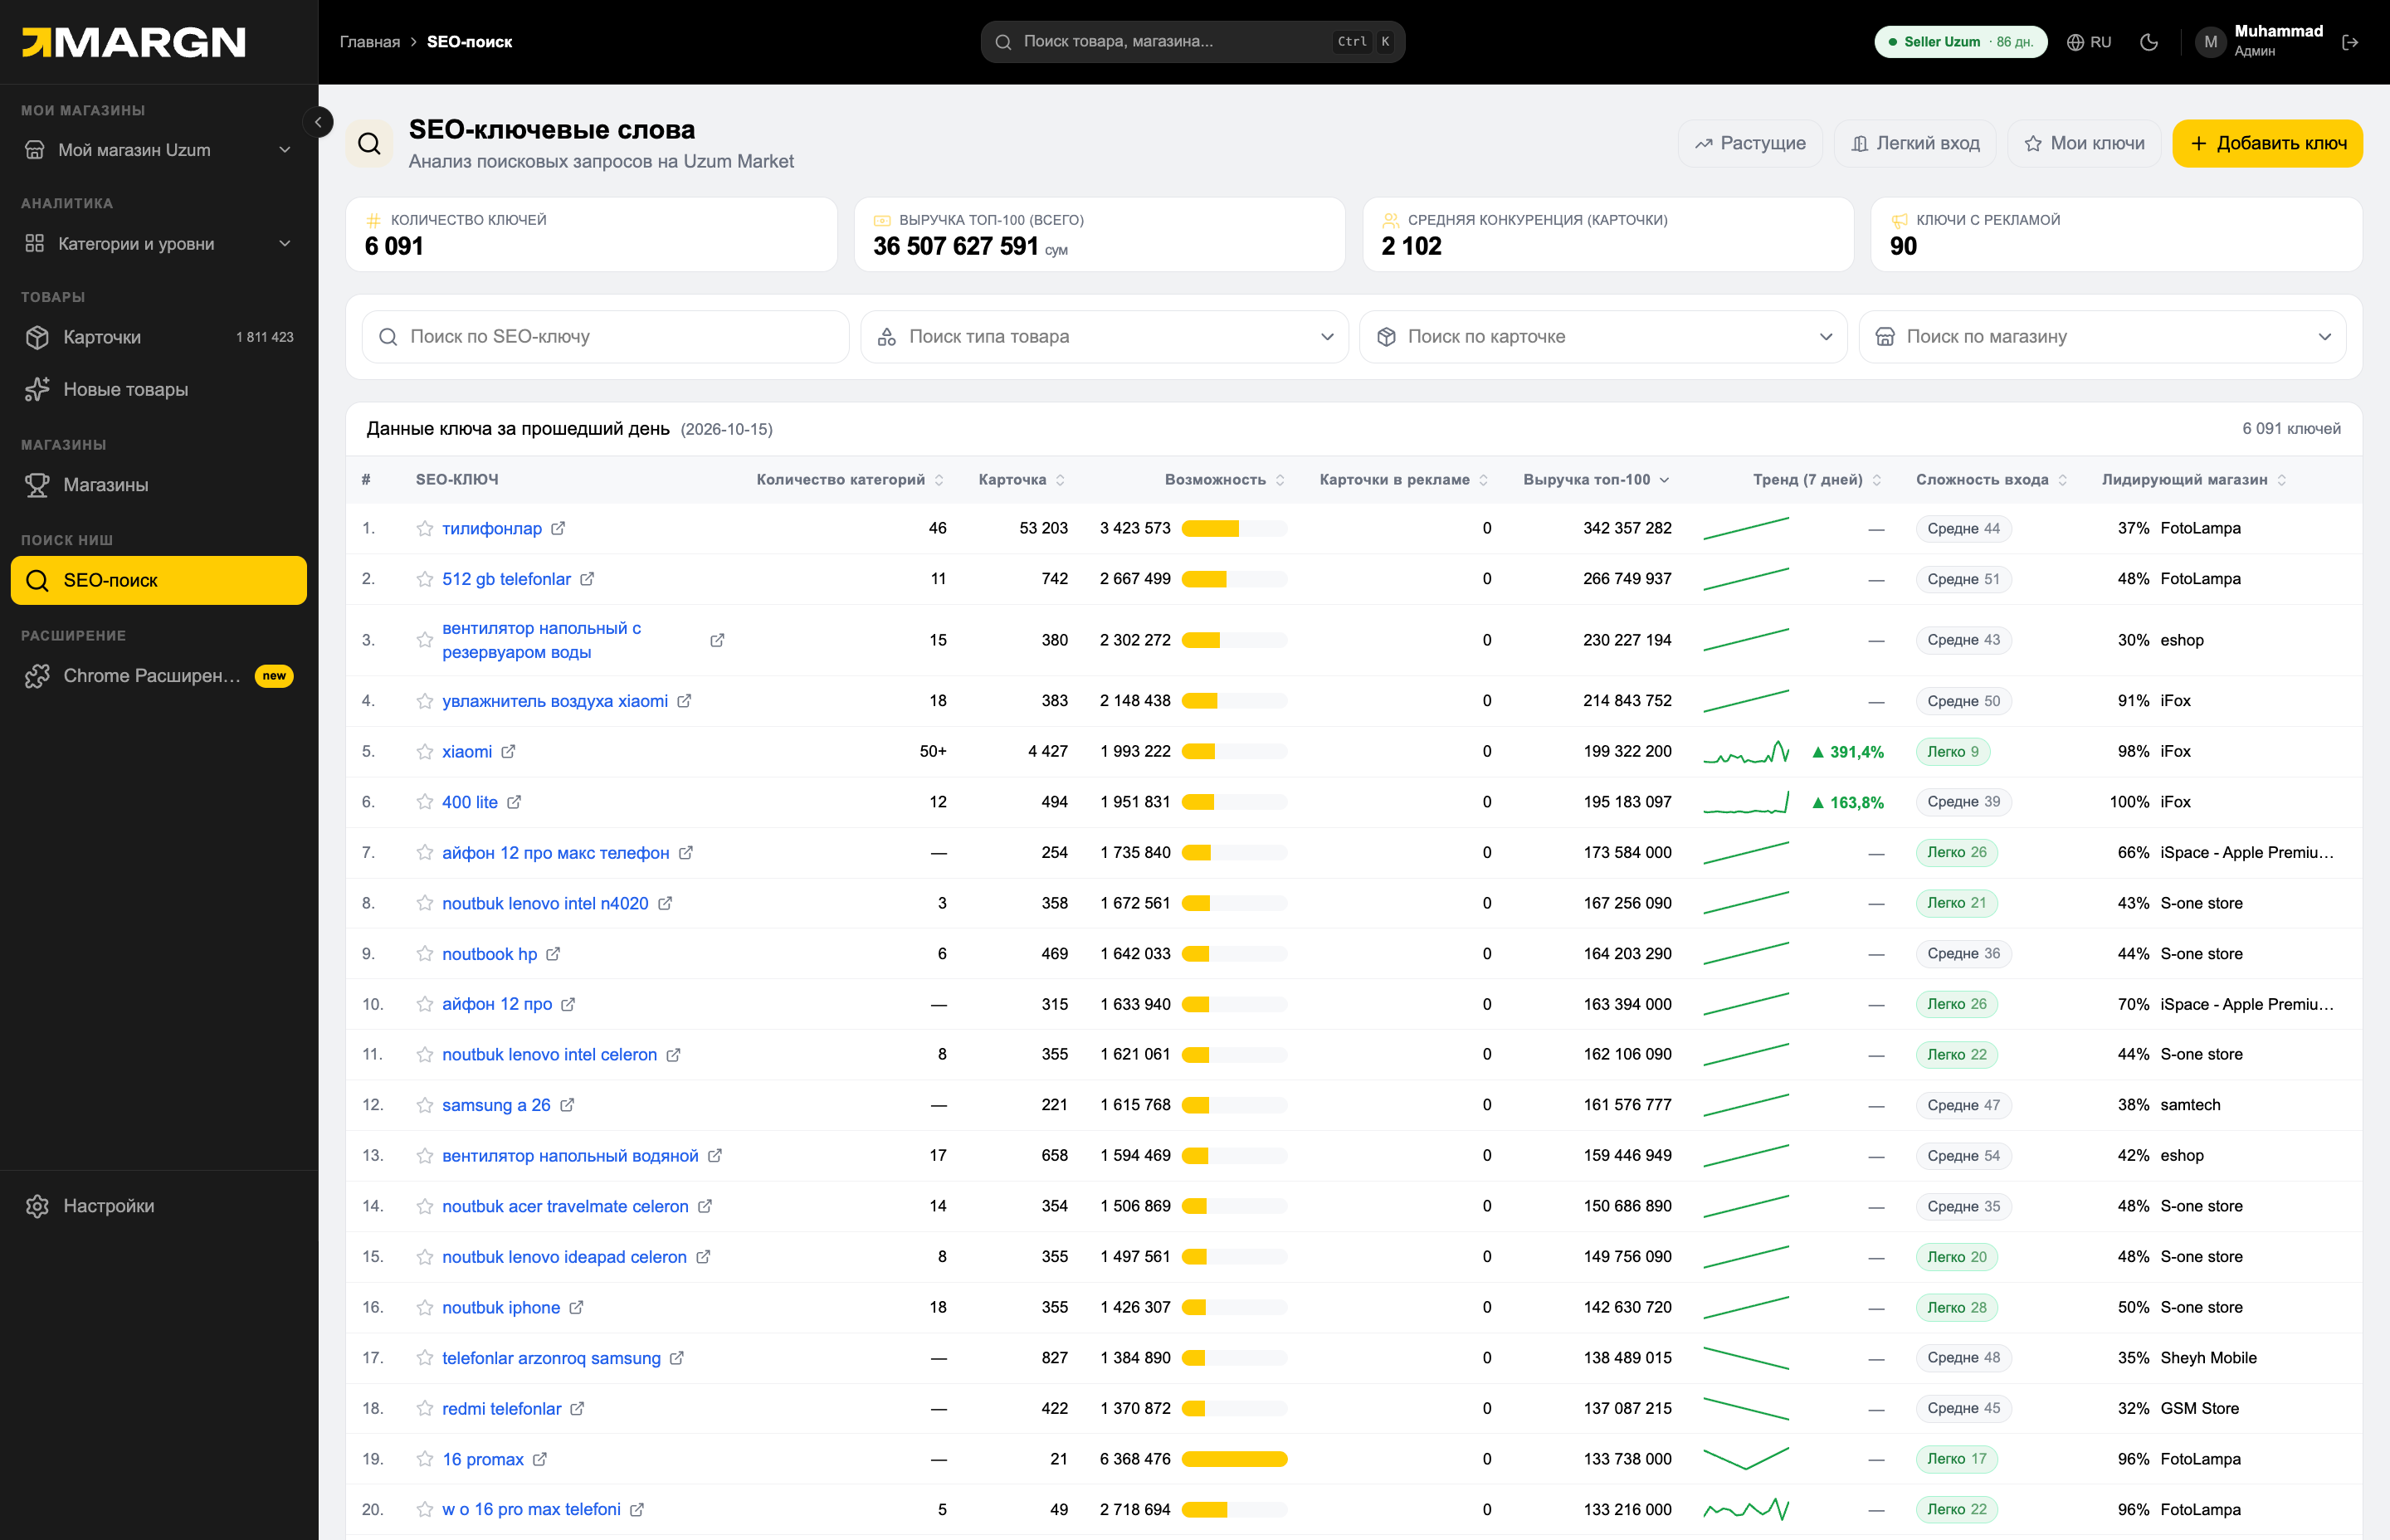
For each query — TOP-100 card revenue, number of cards and entry difficulty. "Opportunity" shows how much money falls on one card: if the value is high, there is demand and competition has not yet filled the niche.
- Selections of growing queries and queries with easy entry
- Entry difficulty score 0–100
- Leading store and TOP-10 positions
How sales and revenue are estimated
Sales and revenue in market analytics are an estimate based on orders and stock changes in the open Uzum catalog. The whole catalog is recalculated 3 times a day.
This is not a competitor's accounting: their cost price, ad spend and other deductions are not visible. So use market figures for comparison, trends and estimating niche size. Your store's figures come directly from your Uzum dashboard.
Market and store — in one subscription
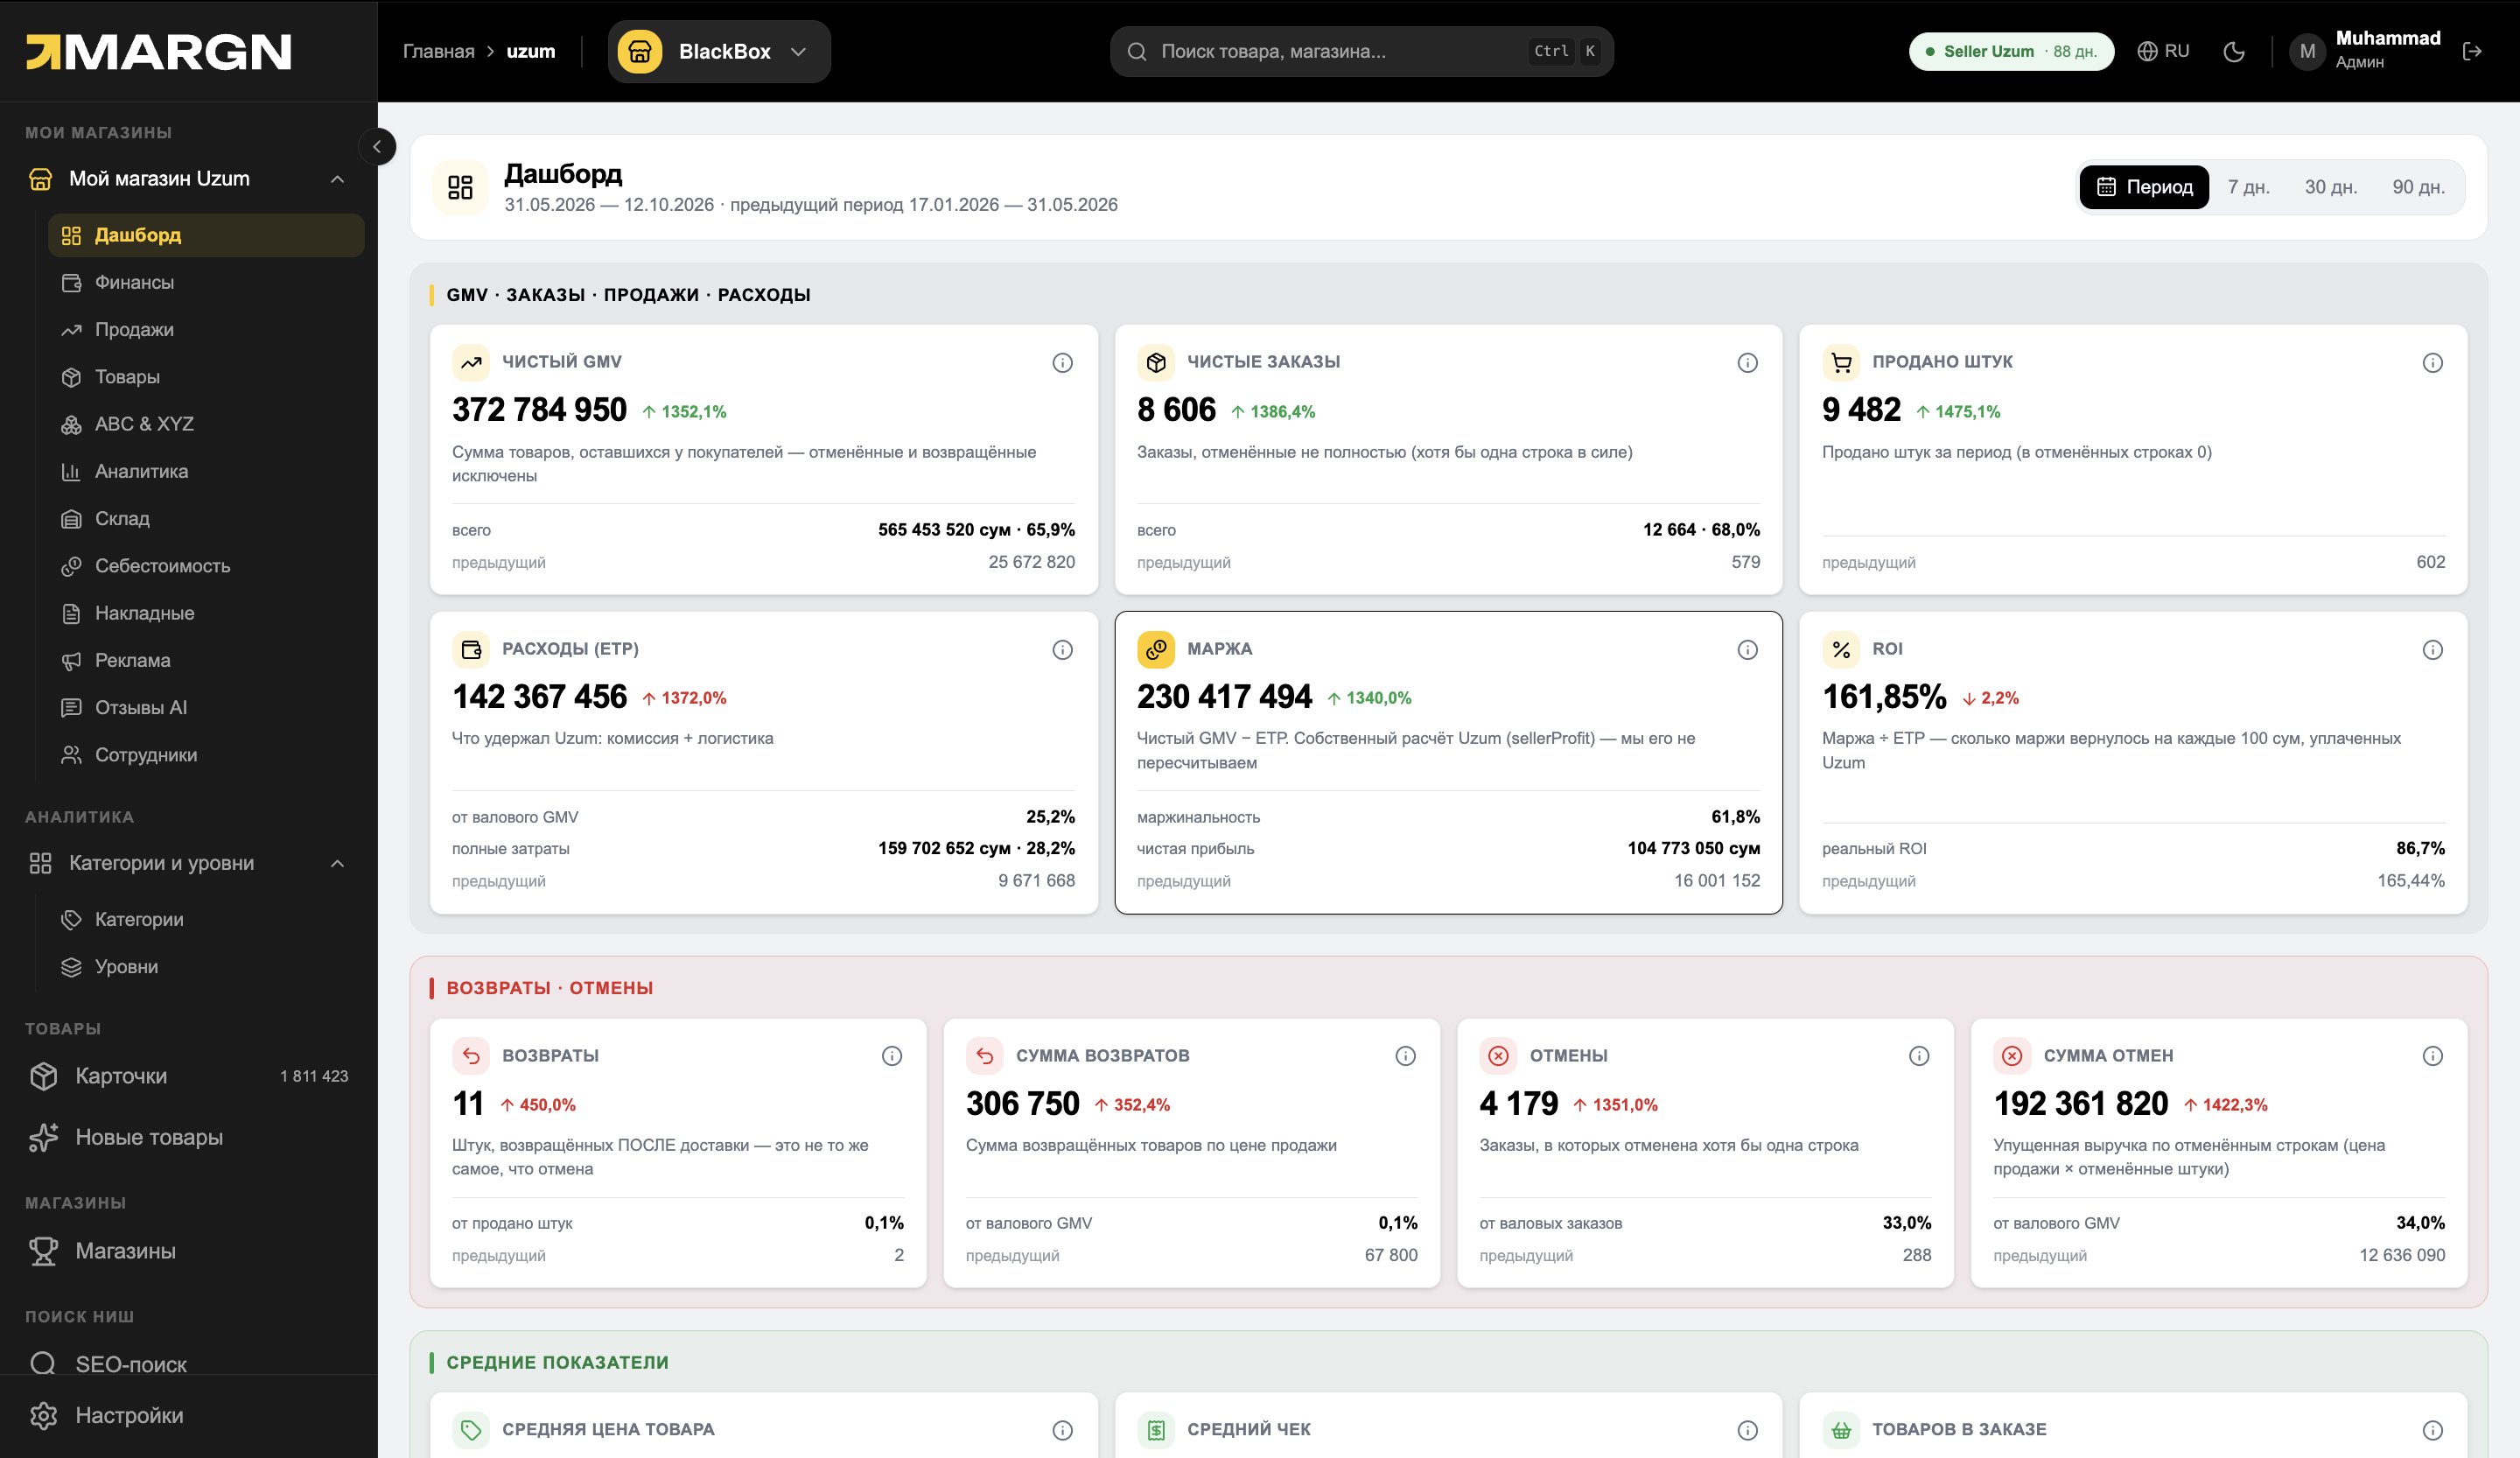
Knowing what sells on the market is half the job. The other half is knowing how much is left from each order in your store. Store analytics subtracts commission, logistics, ads and cost price and shows net profit for each SKU, how many days your stock will last and which ads pay off.
- Net profit and P&L
- ABC and XYZ analysis
- Stock and replenishment plan
- Ads: ACOS, DRR, ROMI
Who it's for
Questions and answers
Is Uzum analytics free?
Where does the data come from?
Can I use it without my own store?
How accurate are competitors' sales?
Are market analytics and the store dashboard paid separately?
Which periods are available?
Pricing
Starter — 499,000 sum per month, Pro — 699,000 sum. Market analytics, the store dashboard and the Chrome extension are in every plan.
Useful tools and articles
See the Uzum market in numbers
7 days of full access. No card needed.