
How to analyze the Uzum market: a 6-step routine

Market analysis is the work you do before buying stock. The goal is simple: to answer "will the product sell, will I find a place in the niche, and will profit remain" with numbers, not feelings. Below is a six-step order for studying the Uzum market. The examples come from the "Market analytics" section in MARGN, but the logic is the same for any tool.
Step 1. Choose a category and set the period
Start with a broad category, then go down the branches. Use 30 days as the base period: it smooths out spikes from promotions and holidays. Then compare with 90 days — that shows growth or decline. A category card has eight key metrics: revenue, units sold, stores, share of selling stores, cards, selling cards, SKUs and sales per day.
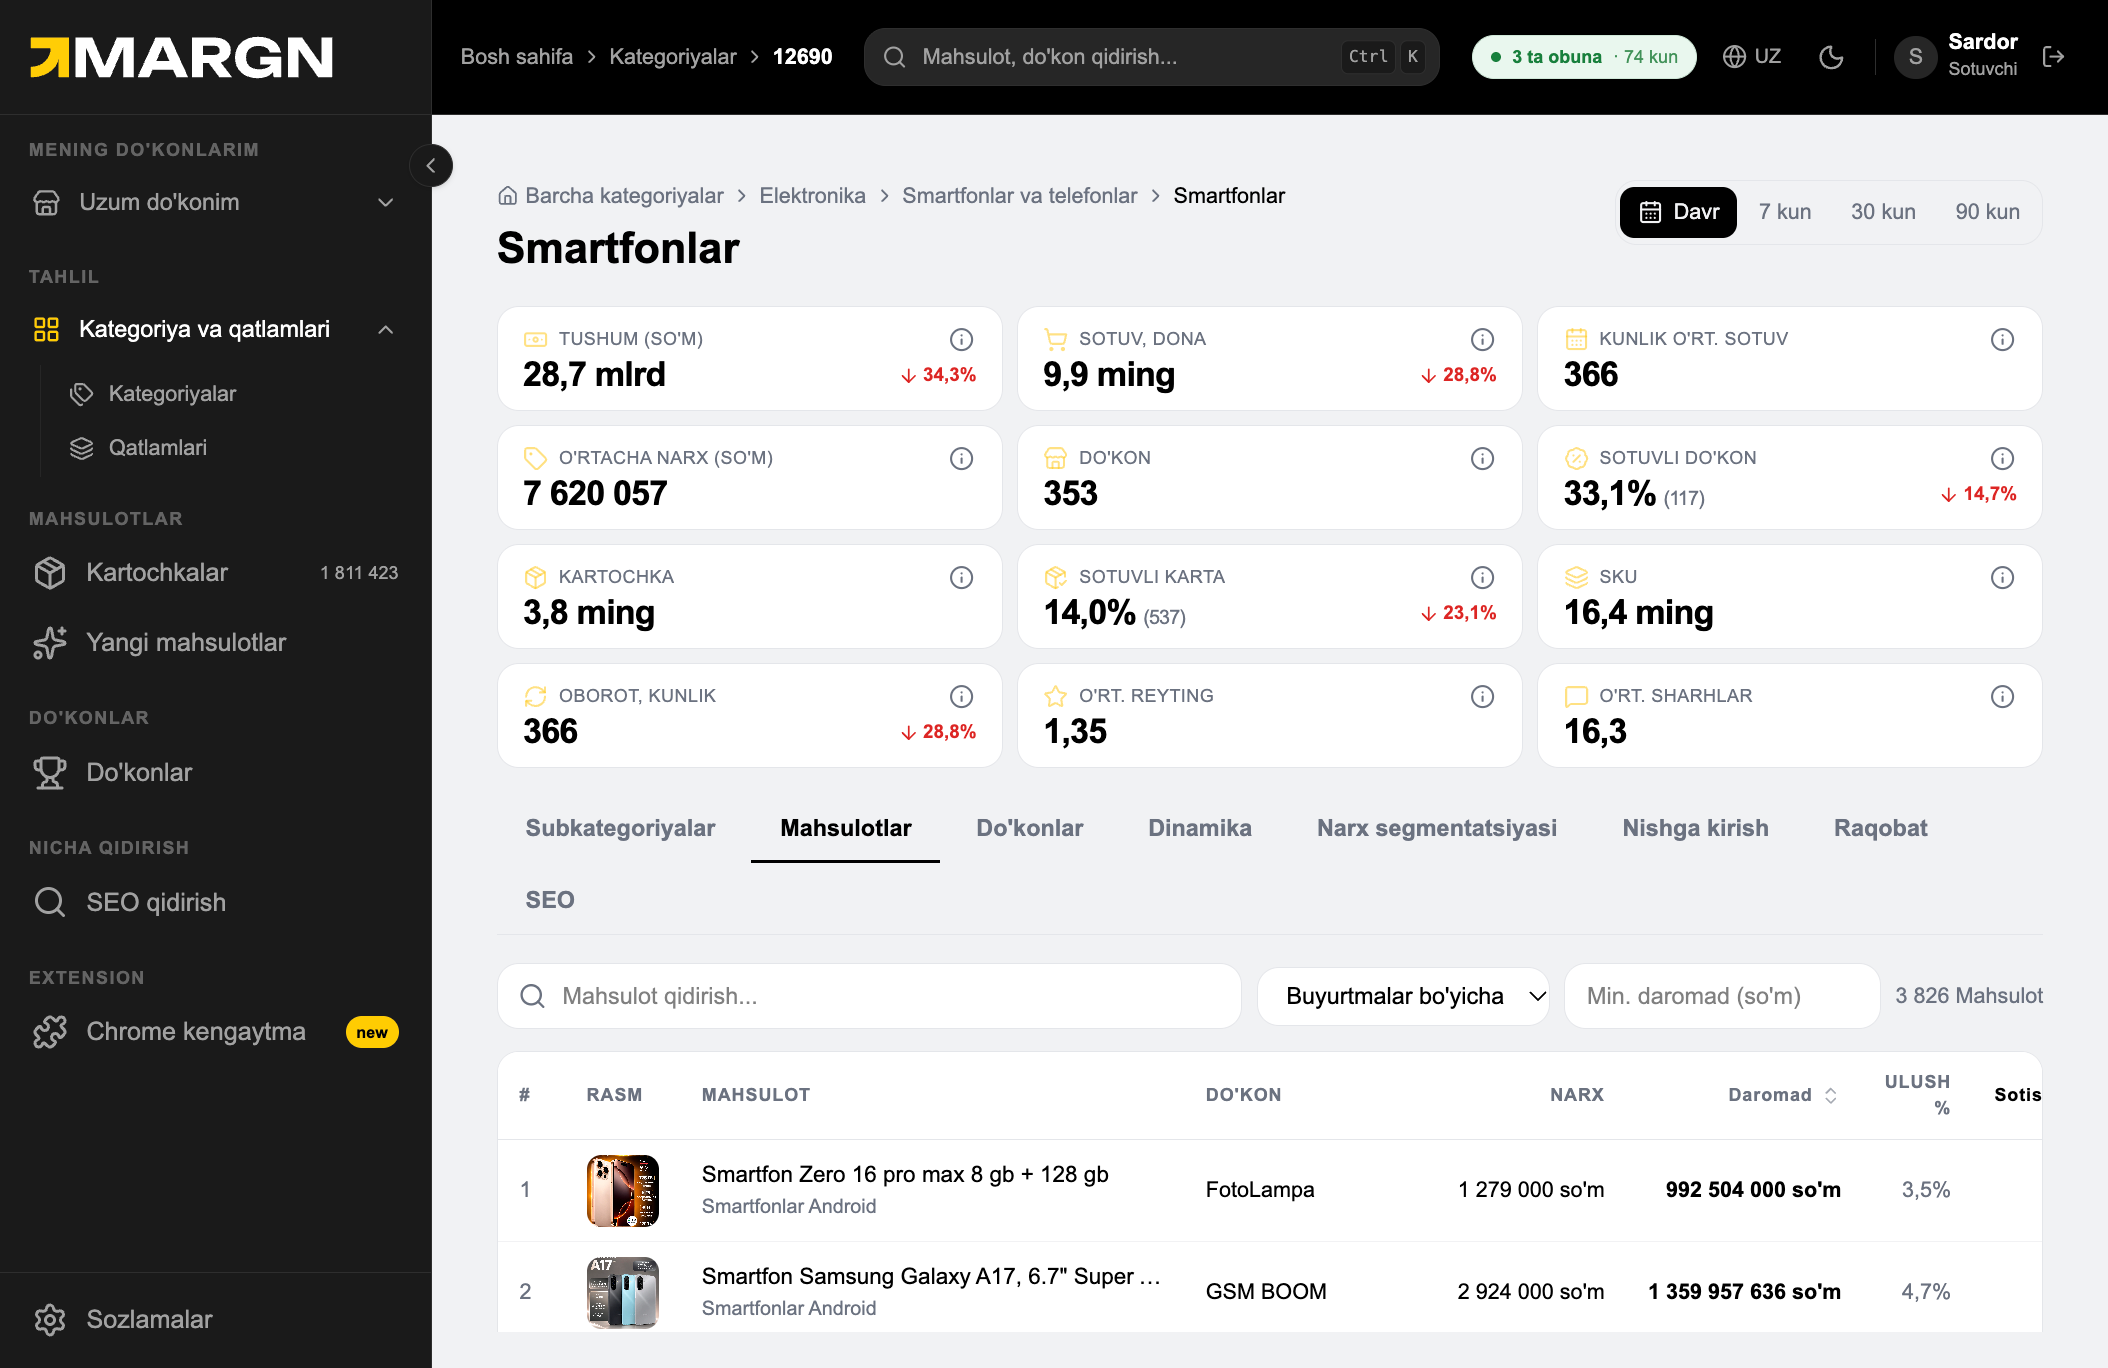
Step 2. Check the niche's key metrics
If a category has high revenue, few stores and a high share of selling cards, there is room in the market. If revenue is high but fewer than 10% of stores sell, the market looks "crowded" although in reality most don't sell. The full list of criteria is in choosing a niche.
Look separately at two metrics:
- Dynamics — whether demand is growing, seasonal or falling (seasonality);
- Price segments — the price range where revenue is high but there are few cards. That range is the best entry point.
Step 3. Assess monopoly and entry level
What share of revenue belongs to one or two stores? If the leader takes most of the market, it is hard to compete with them on price and ads. In a good niche, revenue is spread among dozens of stores. A low "entry difficulty" and a high "opportunity" are a good sign.
Step 4. Study the products
Sort the category's cards by revenue. Questions:
- at what price do the best products sell?
- which SKU (colour, size) leads — that is, what the buyer actually chooses?
- do new cards get many orders in the first 2 weeks? Then there is demand.
- how are sales linked to price changes (did sales grow when the price dropped)?
Cards with little revenue and no reviews show noise, not the market — remove them with a filter. More in what to sell on Uzum.
Step 5. Analyze competing stores
Find the leaders in the ranking and open each one's card: revenue, sales per day, stock, turnover, which brands and categories it is strong in, and its main ("locomotive") products. The goal is not to copy but to find a gap: which price range, colour or warranty they left unattended (competitor analysis).
Step 6. Check search queries
Buyers find products through search. For each keyword look at:
- demand dynamics and revenue;
- how many cards appear for this word and what share of them are in ads;
- entry difficulty (if it is low, even a new card can rise to the top);
- store dominance — if one store takes most of the revenue, the keyword is "closed".
Put suitable words into the card's title and attributes (keywords).
Turn the result into a decision
At the end of the analysis, fill in one table for each idea:
- Market size and dynamics — good / average / poor.
- Competition and leaders' share.
- Target price and net profit at that price (calculator).
- Size of the first batch and risk.
If two or three criteria are poor — drop the product. The goal is not to hold on to one idea but to pick the best 1–3 out of 10–20 ideas.
Mistakes to avoid
- relying on figures from a single day or a promotion week;
- looking only at revenue and forgetting the number of sellers and cards;
- doing the analysis once — the market changes, so recheck the chosen niche once a month;
- not calculating profit and concluding only "it sells".
Once the product is bought and sales have started, the analysis moves to your own store — the account analysis guide.
Source: MARGN Academy — market analytics guides. Sample data — demo account.


