How to analyze your Uzum seller account: a weekly 8-step routine

Once sales have started, the main work shifts from choosing products to reading your account. The Uzum account shows revenue, but it doesn't show where profit is being lost: commission, logistics, ads, storage and cost sit in different places. Below is an 8-step routine you can go through once a week in 30–40 minutes. All screenshots are from the MARGN demo store, and the figures are examples.
Before you start: enter the cost price
Without cost, the profit calculation will be wrong: for a SKU where it isn't set, it is taken as 0 and profit looks higher than it really is. So the first action is to fill in the cost for all SKUs in the "Tannarx" section (directly in the table, or via Excel for many SKUs). How to calculate it is in calculating cost price.
Step 1. Dashboard: the overall picture
Choose a period (usually 30 days) — the account compares it with the previous equal period. The main block shows net GMV, net orders, sales, expenses (ETR), margin and ROI.
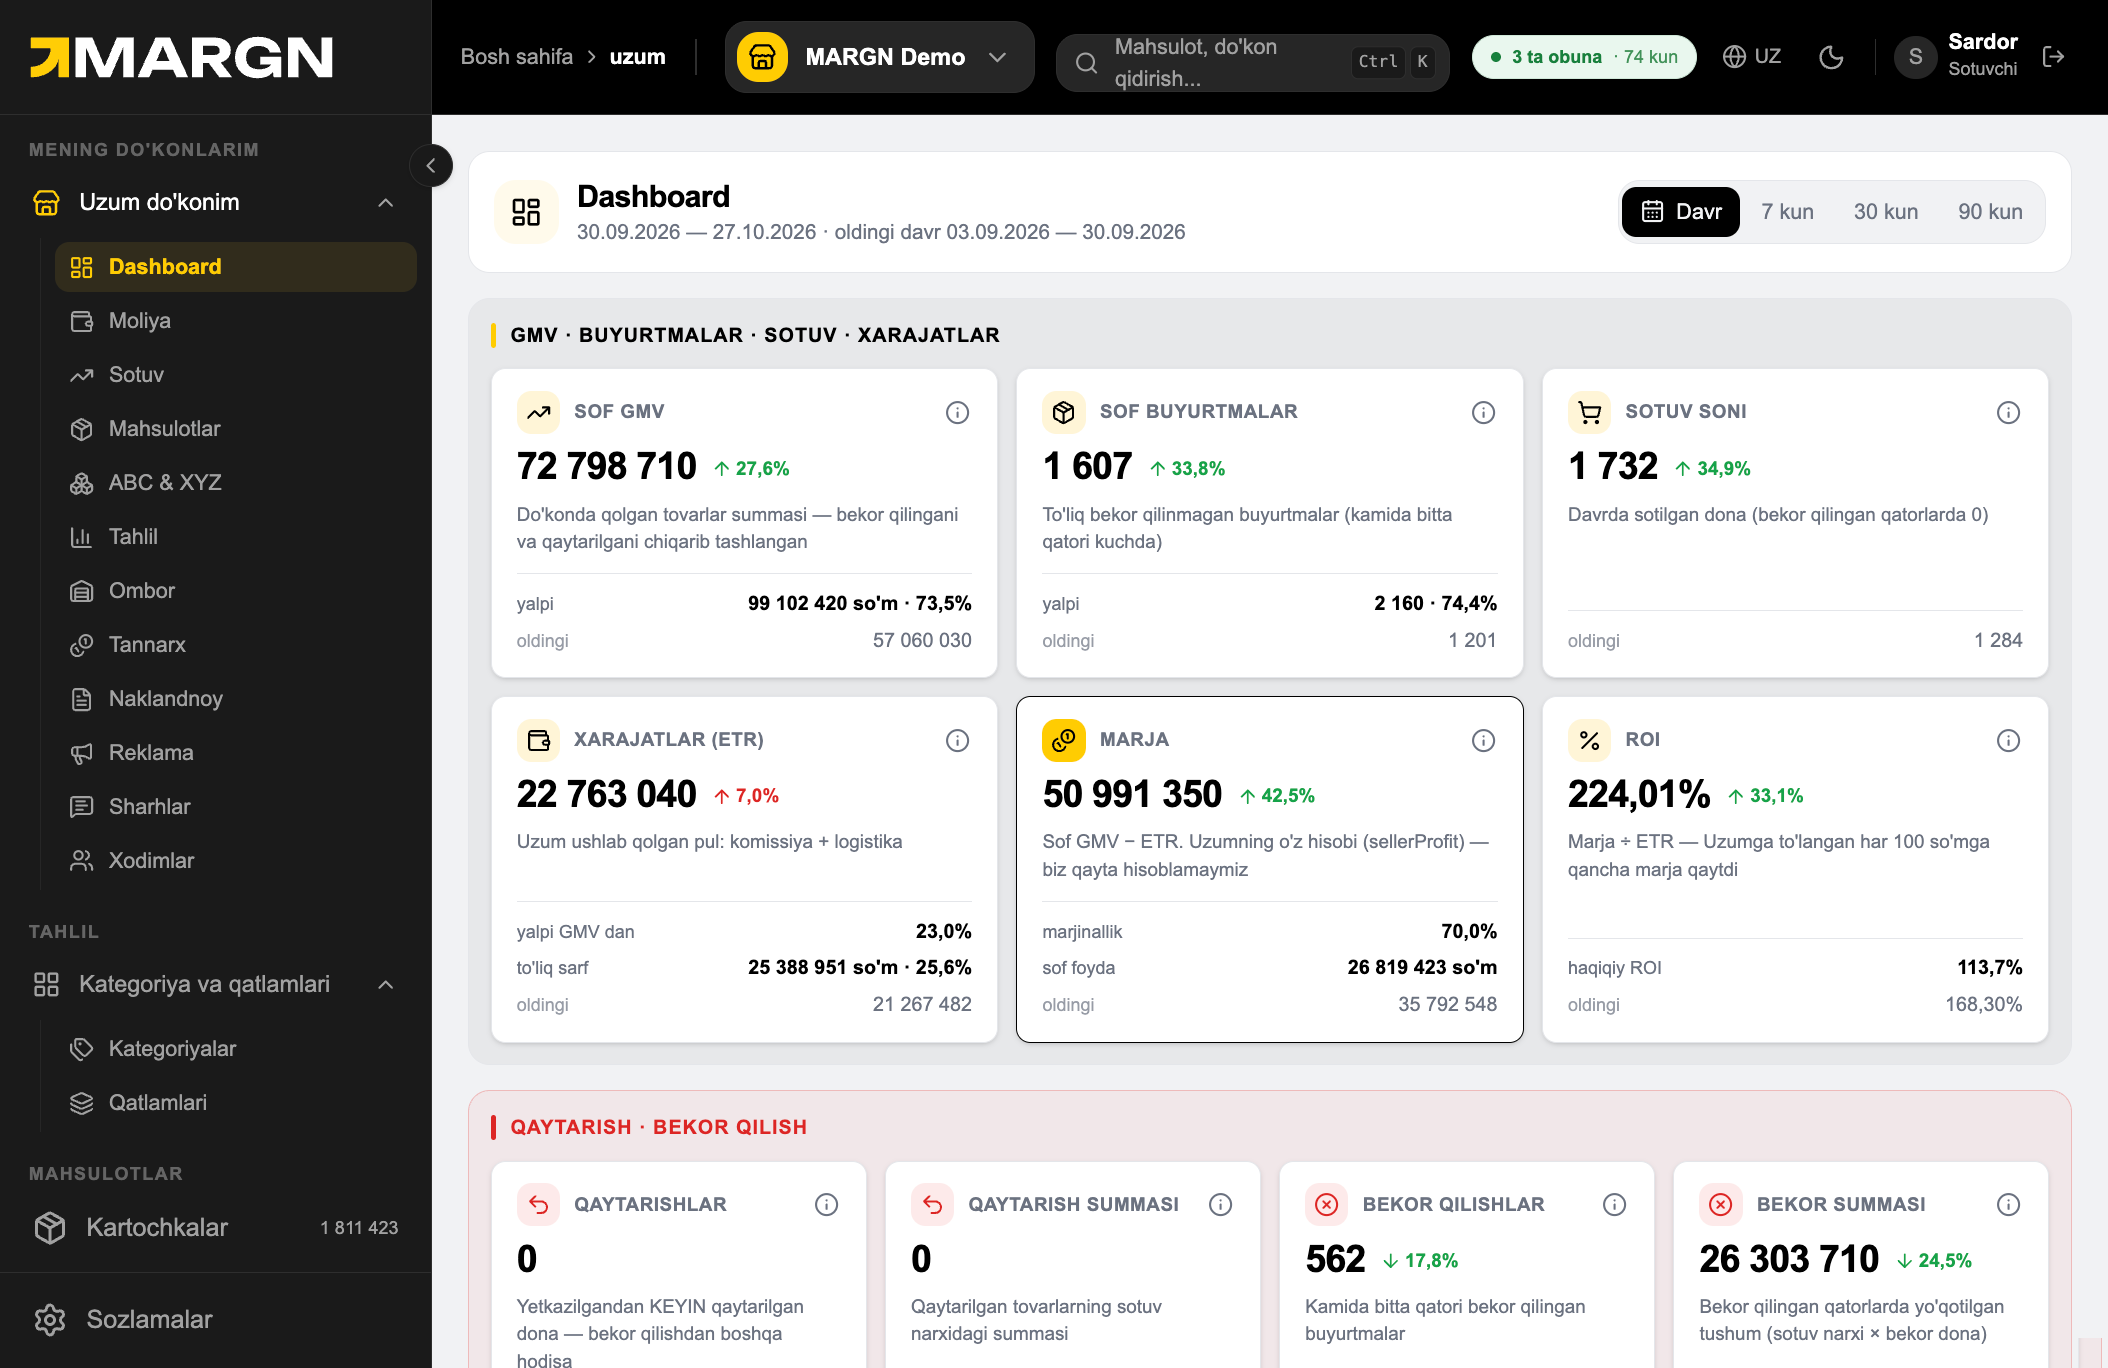
What to look at:
- GMV grew but margin didn't? Then sales are growing at the expense of costs.
- Expense share (ETR). In the demo store it is 23% of GMV — the commission and logistics withheld by Uzum. If the share grows, find the cause.
- The returns and cancellations block. The lost amount in the red block is the quickest profit you can win back.
"Marja" is net GMV minus Uzum's expenses; "Sof foyda" also accounts for cost price. That is why cost price matters so much.
Step 2. Moliya: from revenue to net profit
The "Moliya" section shows everything as one receipt: commission, logistics, ads, warehouse, cost price and manual expenses, and net profit at the end.
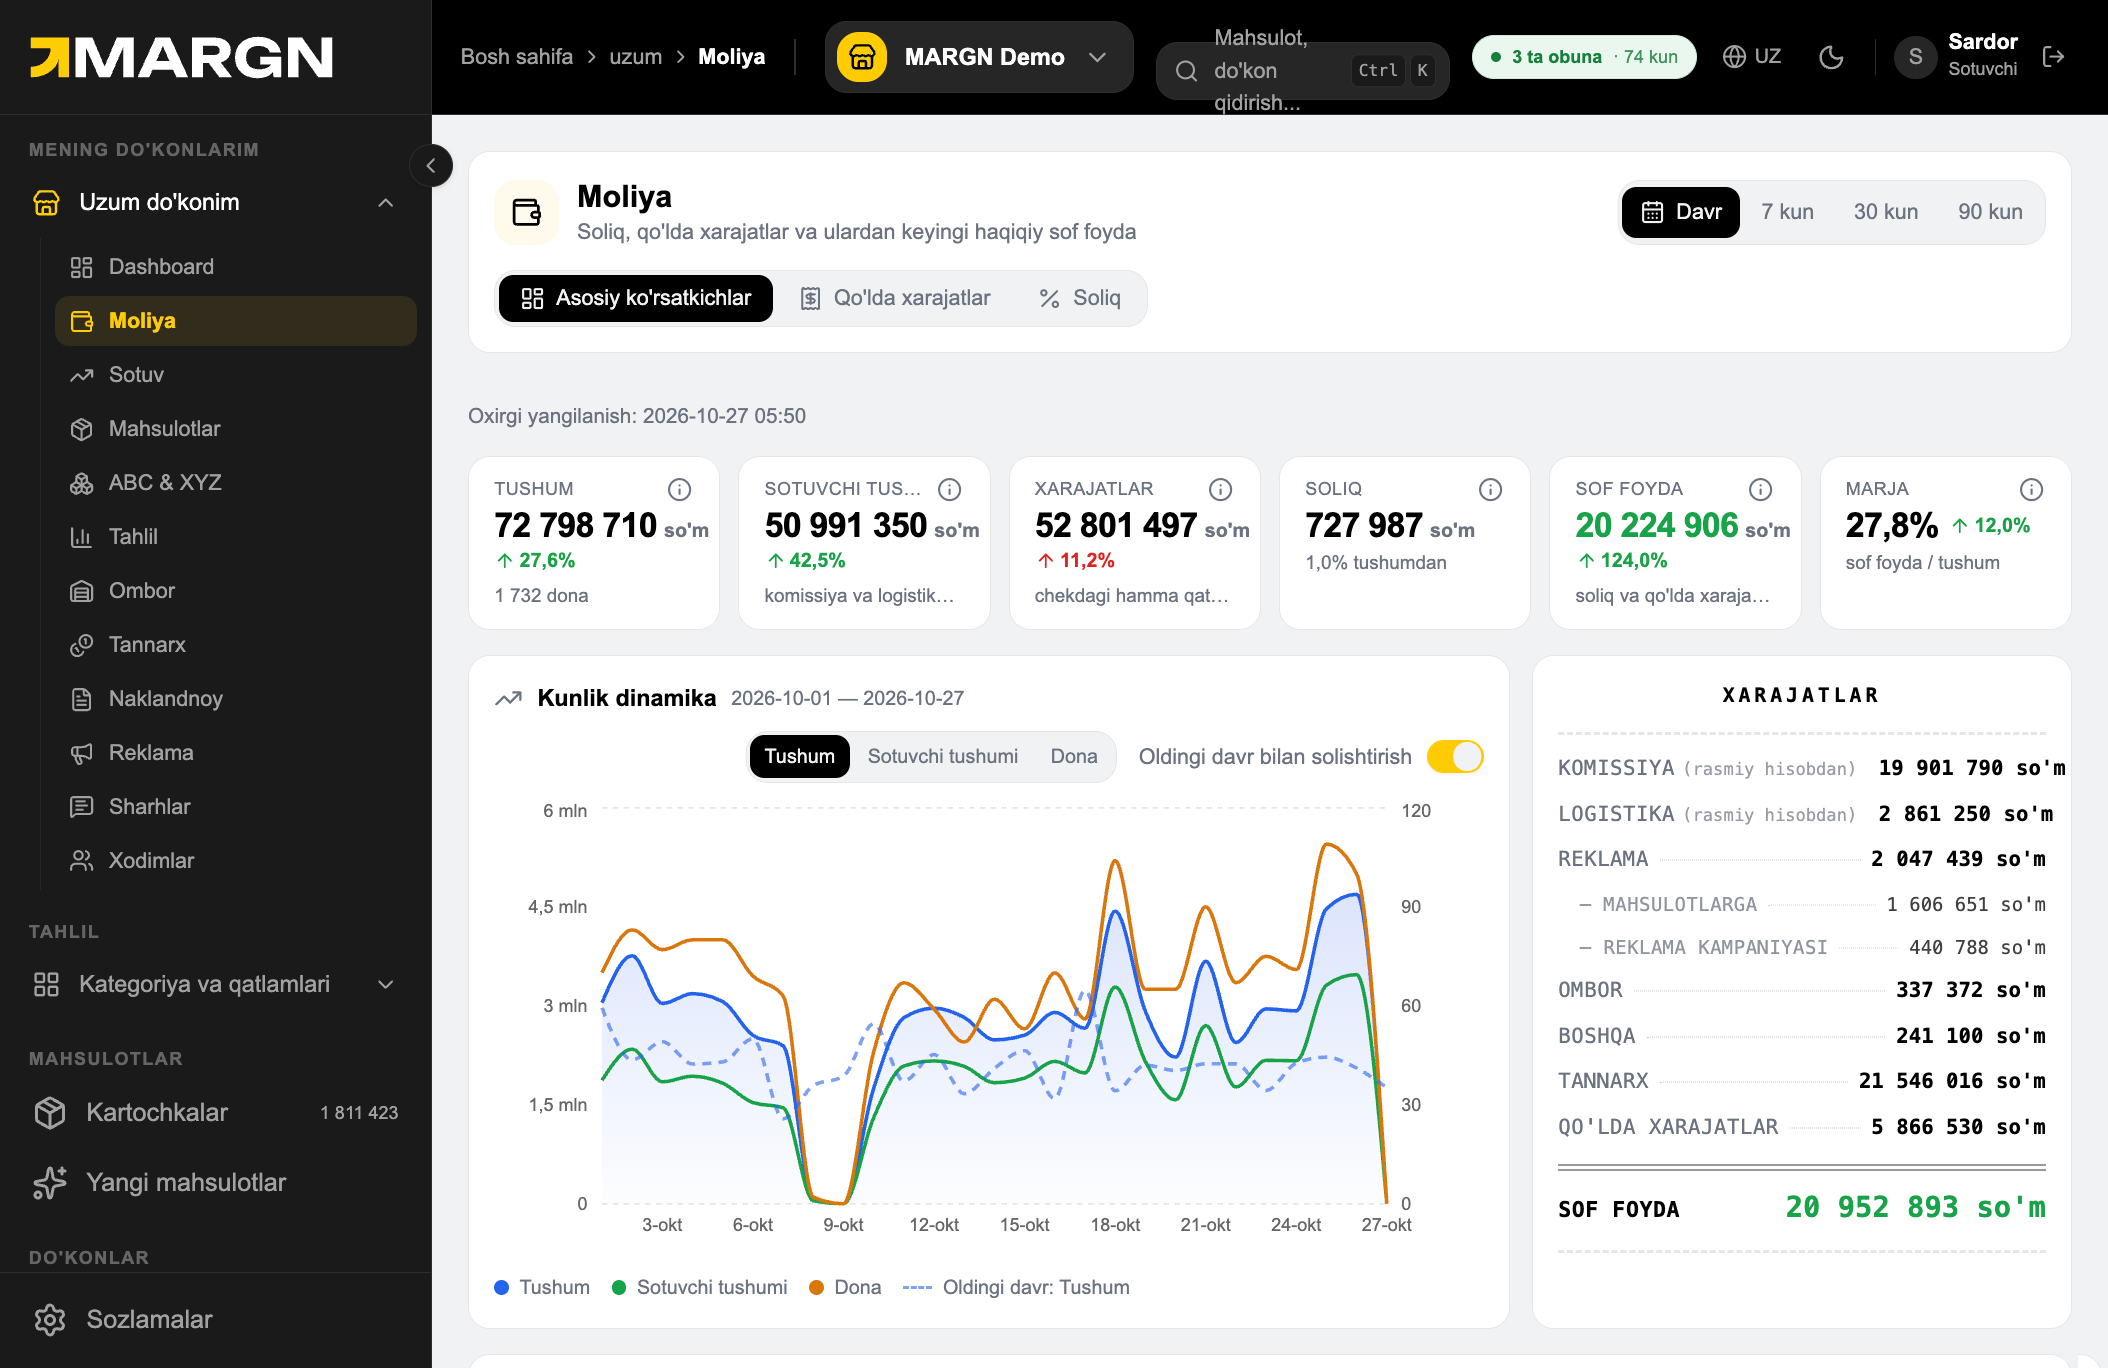
In the demo store revenue is ~72.8 million UZS, net profit ~21 million UZS, margin 27.8%. That is, 28 UZS remains from every 100 UZS of revenue. Ask a question of each line of the receipt:
- commission took ~27% of revenue; if the category hasn't changed, that's normal;
- cost price is the biggest item; can the price be renegotiated with the supplier?
- manual expenses (rent, salaries, packaging) are absent from the Uzum report but eat into profit. Enter them in "Qo'lda xarajatlar" and set the tax rate once.
Turn on "Oldingi davr bilan solishtirish": you will see in red which expense grew. The calculation logic is in net profit.
Step 3. Mahsulotlar: who brings money and who loses it
The most important table is profit and margin for each card.
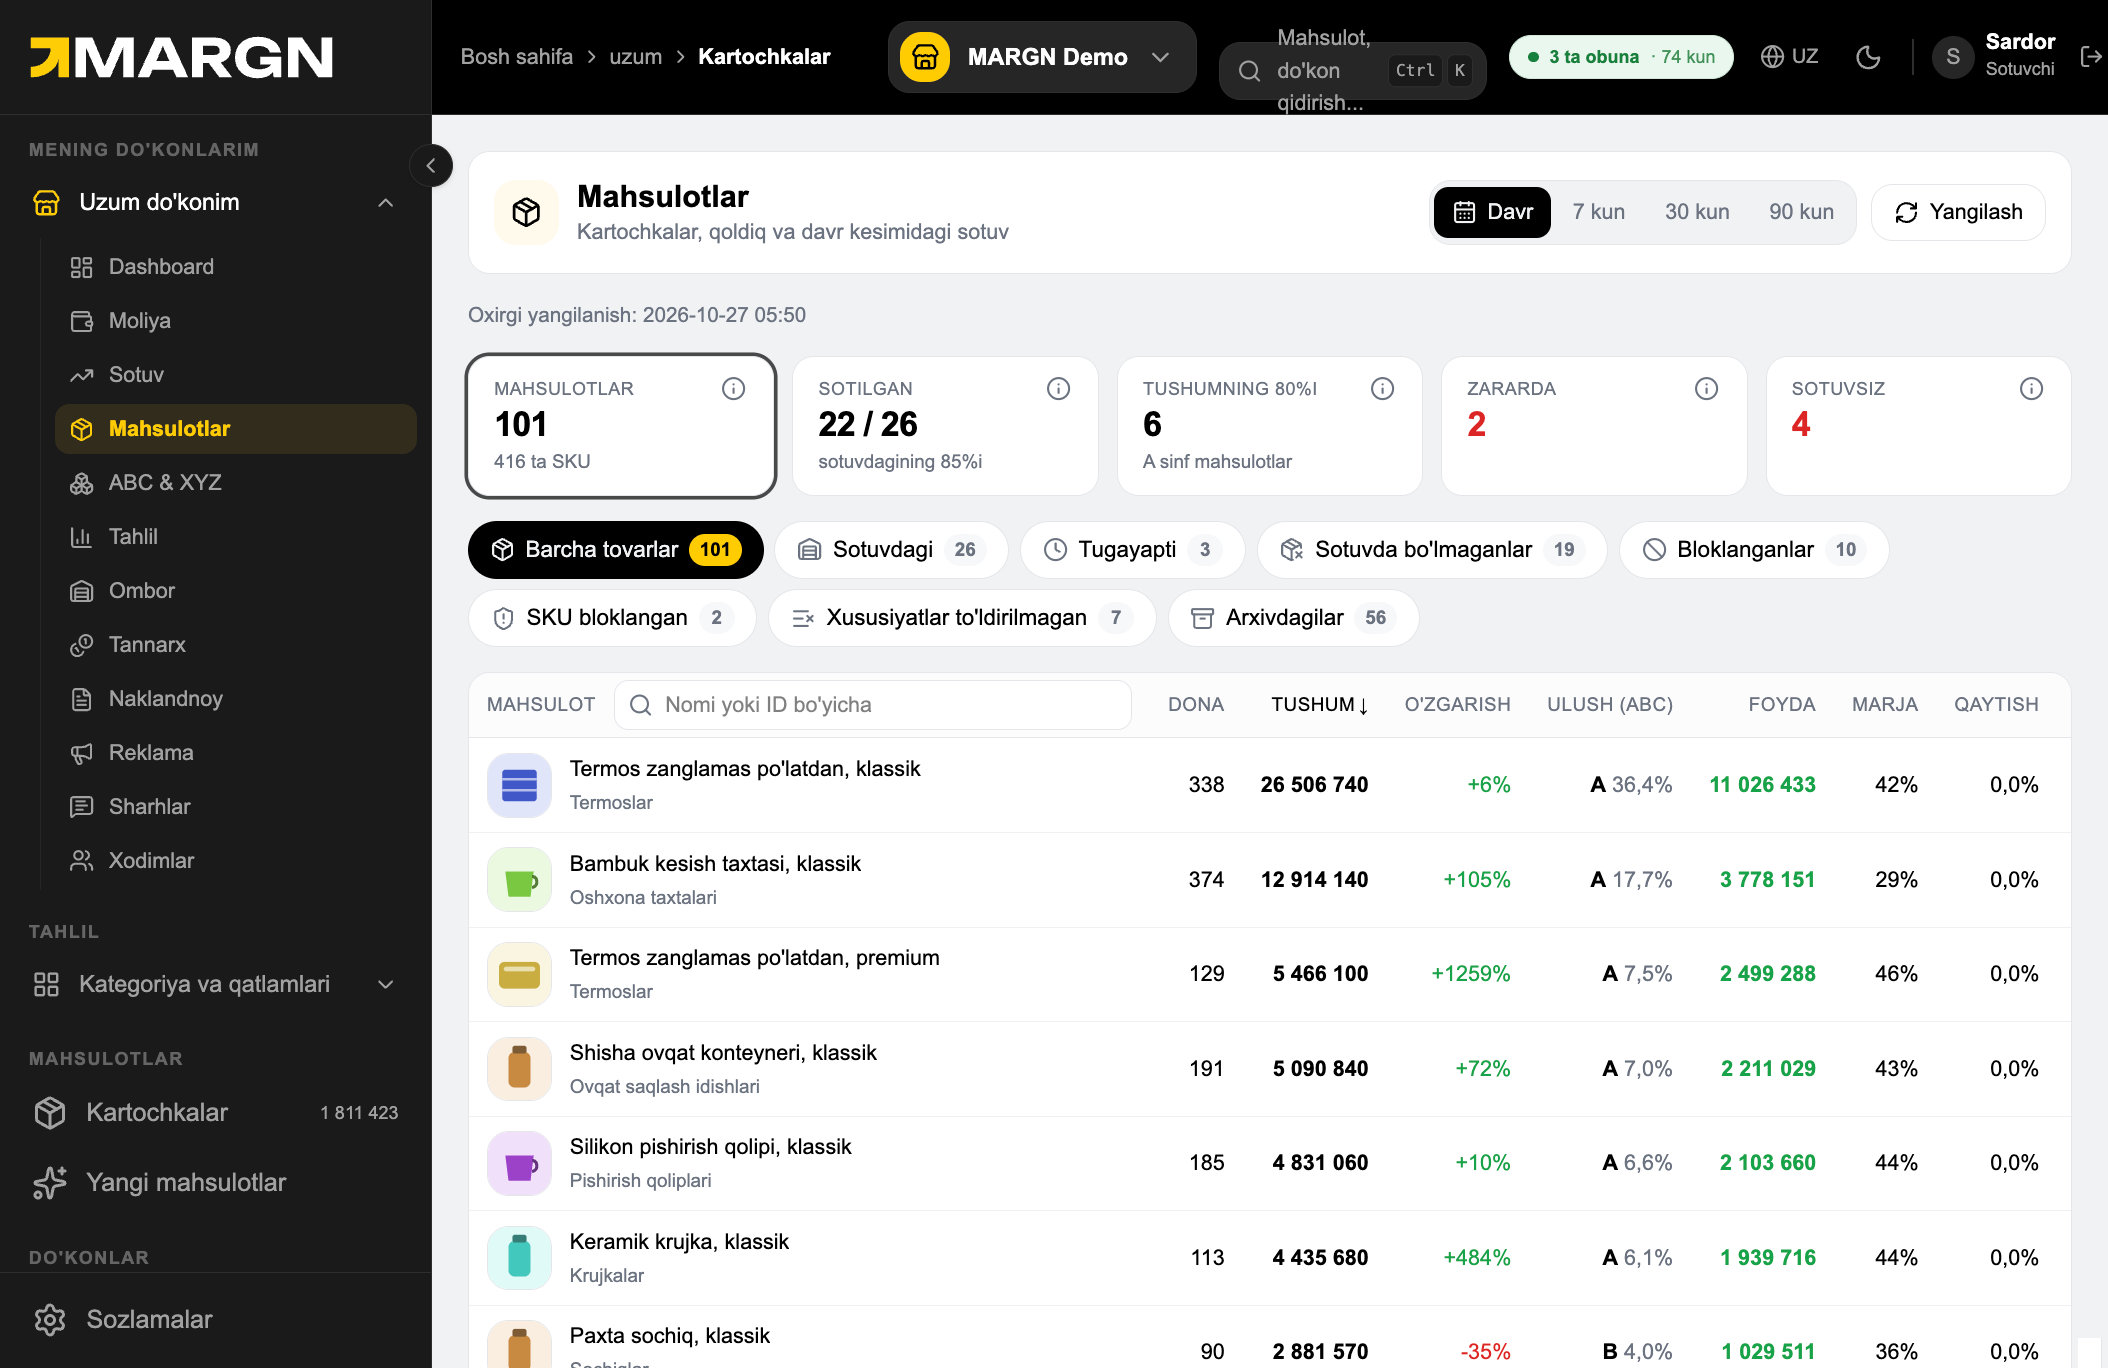
In the demo store, of 101 cards 26 are on sale and 22 sold; 6 class A products bring 80% of revenue; 2 are loss-making, 4 have no sales. If you click the "Zararda" tile, the list filters to loss-making products. Questions:
- in a loss-making product, is the problem the price, the cost or the ads?
- is a card with no sales getting ads? If so, stop them;
- the product that brings the most profit (in the example a thermos, margin 42%) — will its stock last?
Clicking a row opens the product panel: sales, ads, cost, how many days stock will last and margin by SKU.
Step 4. Reklama: DRR and ACOS
The "Reklama" section shows spend, ad revenue, DRR and profit from ads.
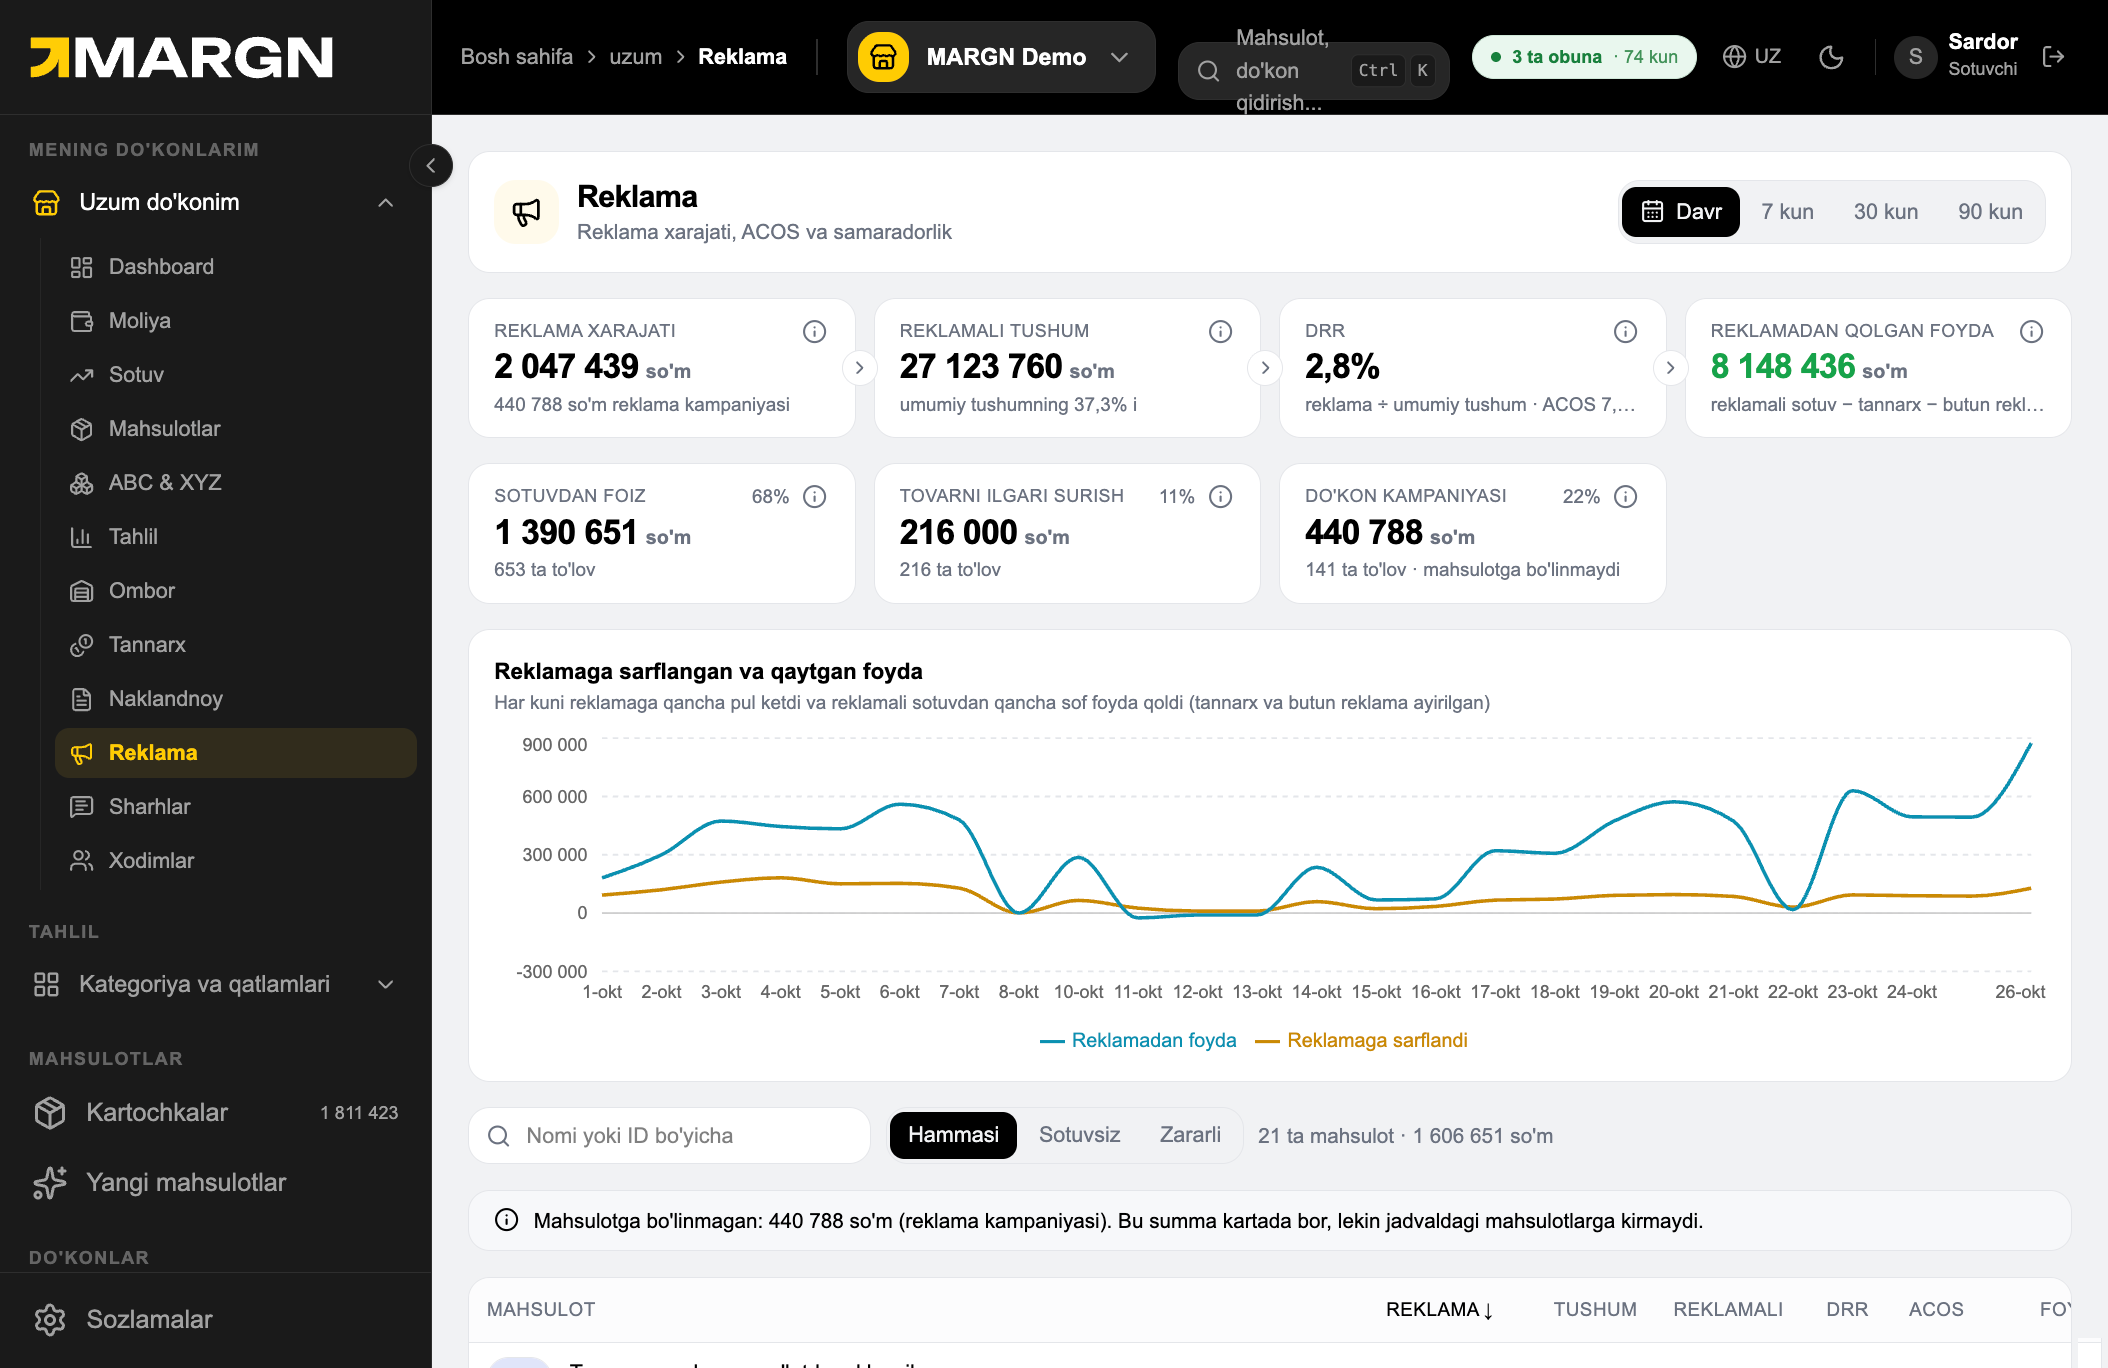
In the demo store DRR is 2.8% (ads ÷ total revenue), ACOS is the share of ad revenue. If DRR grows while profit from ads falls — review your bids. In the table look at the "Sotuvsiz" (money spent, no sales) and "Zararli" (ads don't pay off) filters. More on the metrics in ad metrics.
Step 5. Sales and cancellations
"Sotuv" → "Bekor tahlili" shows the share of cancellation reasons.
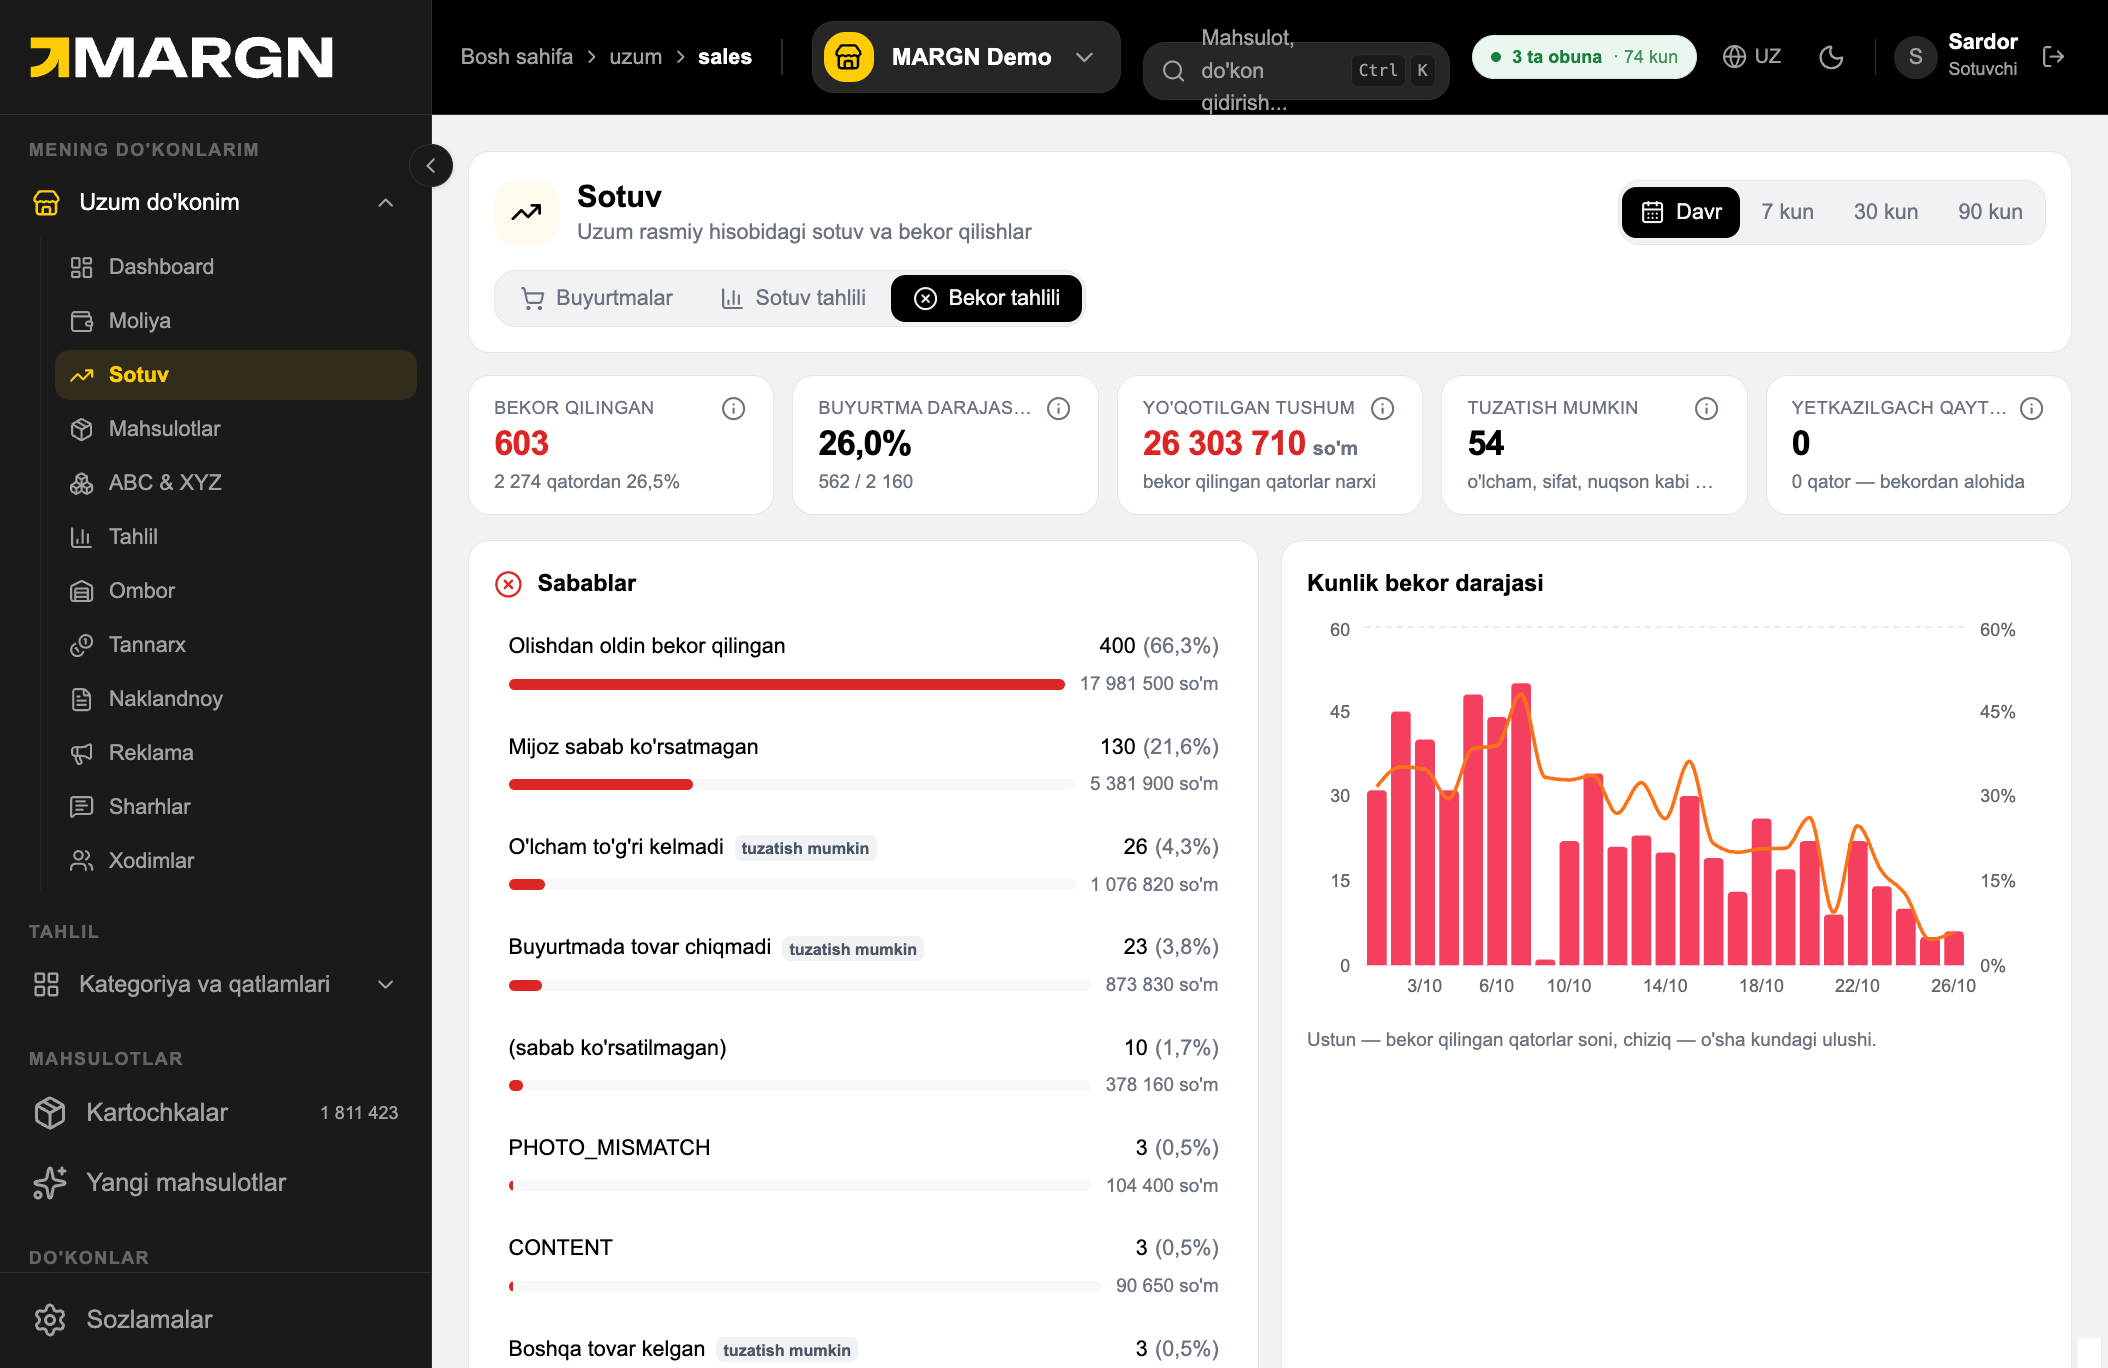
In the demo, 603 of 2,274 rows were cancelled (26.5%). The biggest reason is "Olishdan oldin bekor qilingan" (66%): that is the buyer's decision and doesn't depend on you. But reasons marked "tuzatish mumkin" — the size didn't fit, the item was missing from the order, the wrong item was sent — are your losses: 54 in the demo. You reduce them by clarifying the size chart in the card and controlling stock. In FBS/DBS cancellations also lead to penalties (penalties).
Step 6. ABC & XYZ: managing the assortment
ABC groups products by revenue, XYZ by demand stability.
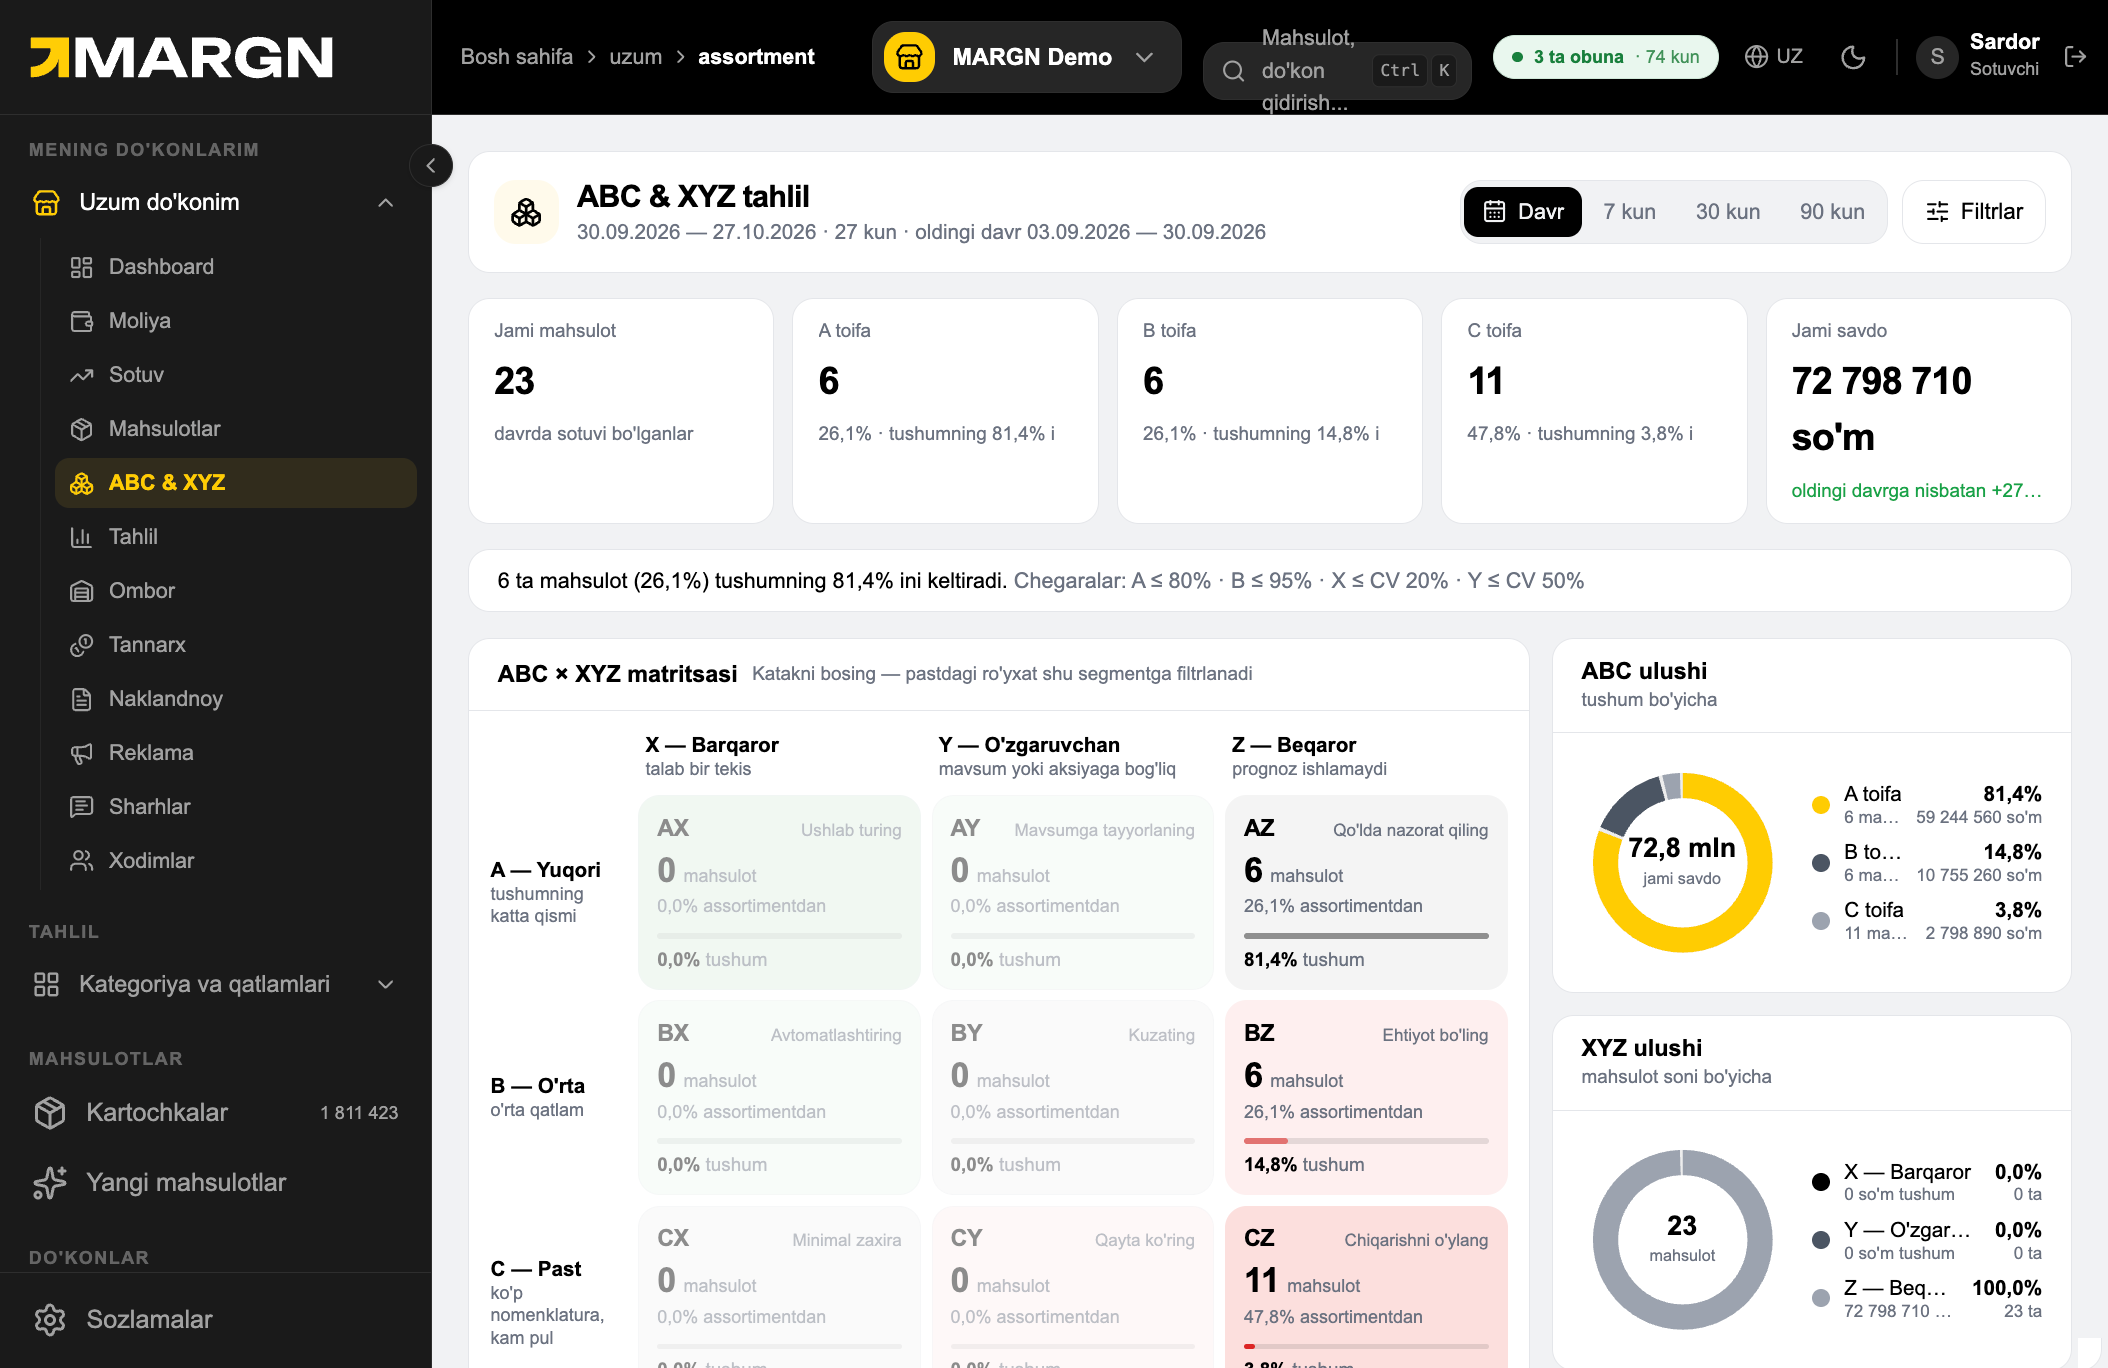
In the demo, of 23 products 6 (group A) bring 81% of revenue and 11 (group C) just 3.8%. Each matrix cell has a recommendation: for example, A+Z — keep under manual control; C+Z — consider dropping. The rule: direct money to group A, cut group C products. More on the page ABC & XYZ analysis.
Step 7. Ombor: stock and paid storage
"Ombor" shows how many days stock will last and which products have gone to paid storage.
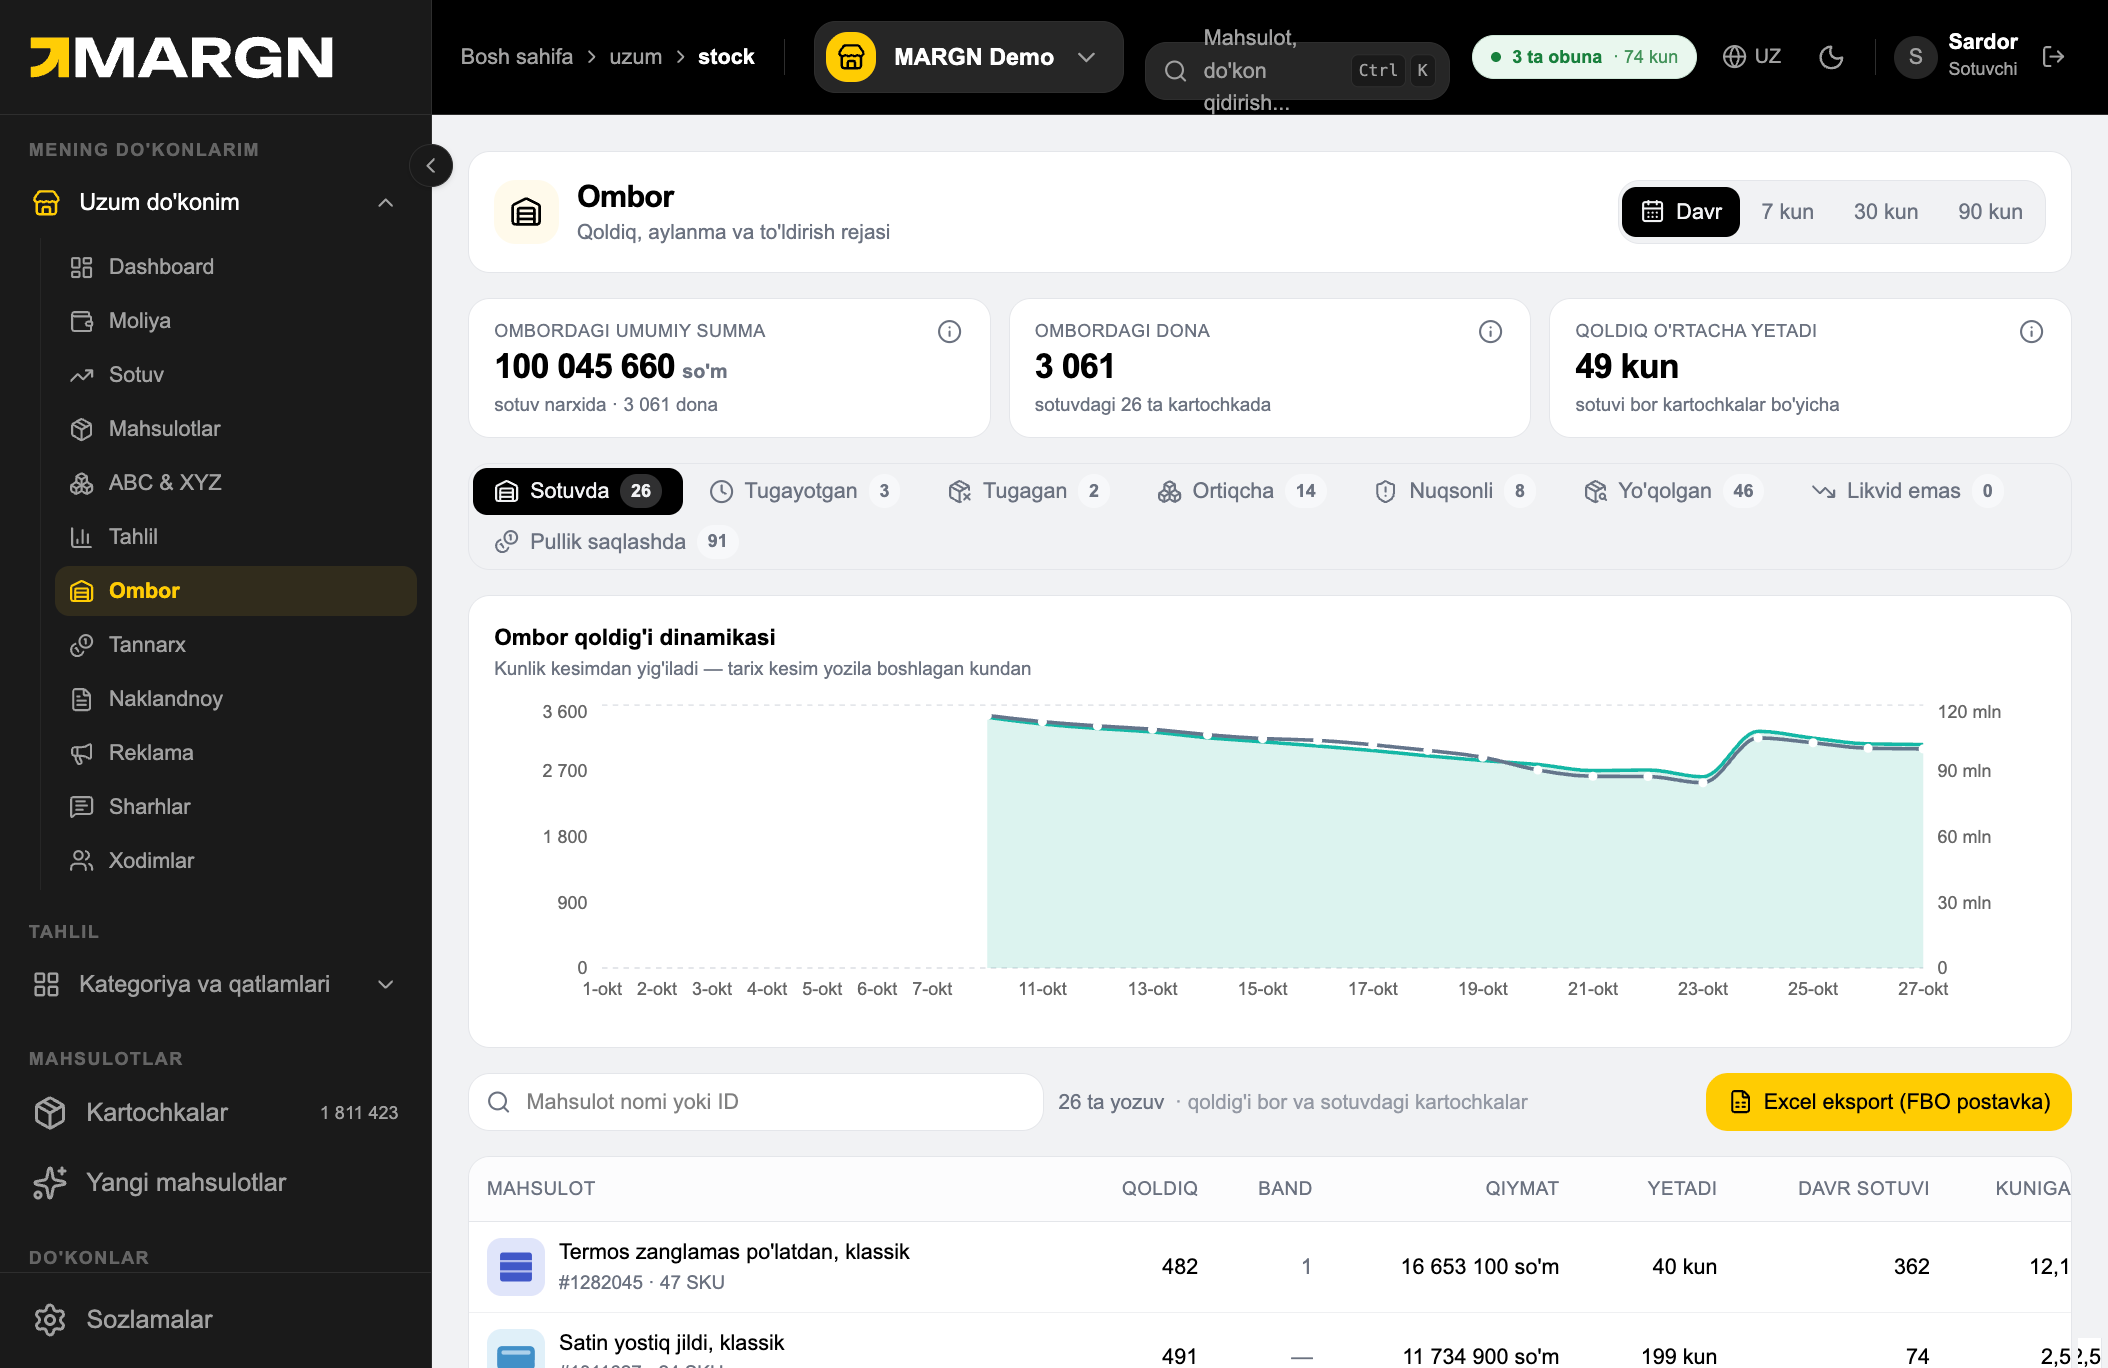
In the demo store stock lasts 49 days on average, 3 products are running out, 2 are out, 14 are in excess, 91 SKUs are in paid storage. The rule: a card that runs out loses its search position — start a delivery when there is less than 7 days of stock left. Excess stock after 60 days eats money (paid storage, stock planning). "Excel eksport" prepares the list for an FBO shipment.
Step 8. Tahlil: what needs attention today
At the end open the "Tahlil" page — a summary of alerts: sales, stock, ads, content and reviews.
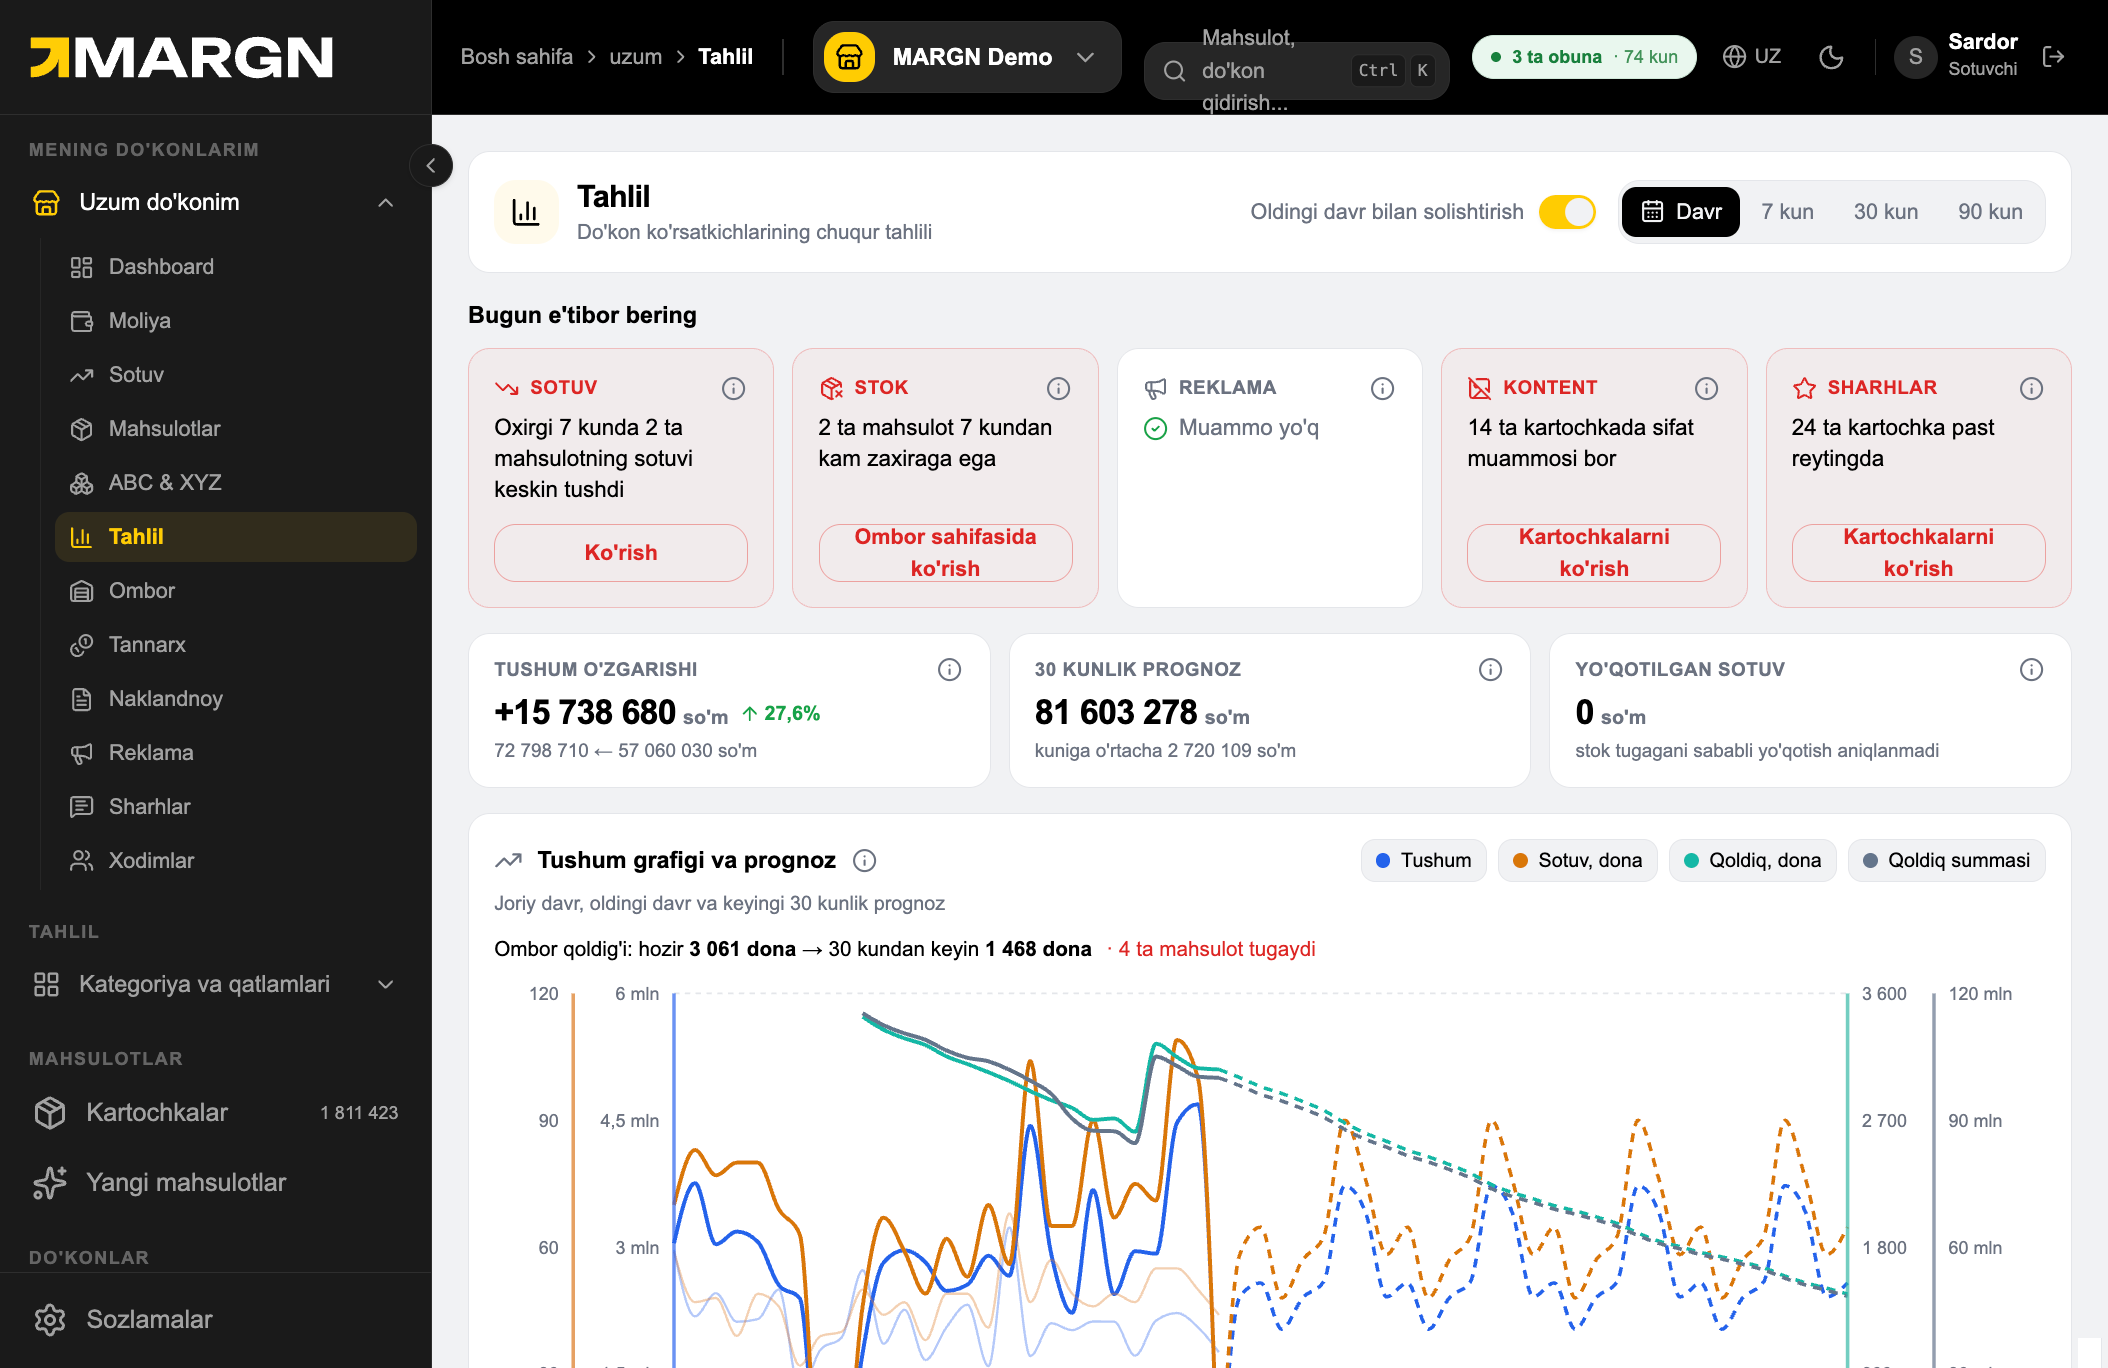
Each card has the problem and a button to the problem products. In the demo store: 2 products have a sharp sales drop, 2 have less than 7 days of stock, 14 cards have quality problems, 24 have a low rating. Below are the revenue chart and a 30-day forecast, and "lost sales" (from running out of stock). Review replies are here too: keep unanswered ones at zero (replying to reviews).
Weekly checklist
- Dashboard: GMV, margin, ROI — what changed against the previous period?
- Moliya: which expense's share grew?
- Mahsulotlar: loss-making and non-selling products — stop or fix.
- Reklama: the "Sotuvsiz" and "Zararli" rows.
- Cancellations: the "tuzatish mumkin" reasons.
- ABC & XYZ: is there stock for the group A products?
- Ombor: stock under 7 days and paid storage.
- Tahlil: red alerts and unanswered reviews.
The most common mistakes
- looking at profit without cost price;
- watching only revenue and not margin;
- looking at ad spend overall rather than by product;
- not analyzing cancellation reasons;
- opening the account only when a problem appears.
All of this is in one place in MARGN: store analytics. Detailed screenshot guides for every section are in MARGN Academy. How to study the market before buying stock is in market analysis.
Note: the figures in the screenshots are from a demo store; your results will be different.